About the LevelUp series: At The Markup, we’re committed to doing everything we can to protect our readers from digital harm, write about the processes we develop, and share our work. We’re constantly working on improving digital security, respecting reader privacy, creating ethical and responsible user experiences, and making sure our site and tools are accessible.
At The Markup, we see publishing a story as only one segment of a relay race focused on creating real, positive impact.
Investigative journalism cannot be done in a silo. Most of our stories involve talking to many, many people—community members, researchers, regulators, statisticians, you name it. We are constantly passing the baton, and through that, we as journalists get a better understanding of the harm we’re investigating, who is impacted, how it came to be, and what people can do about it.


When we publish our data-driven investigations, we pass the baton again, to you, our readers. Our work, at its best, gives people the critical information they need so that they’re equipped with the tools, knowledge, and agency to drive change. That’s why our primary gauge of success is measuring the extent to which that happens—how much impact our investigations have on society.
This impact can take many forms. Readers might alert their friends about our advice on how to protect their personal data from being sent to third-party companies, for example. Or they might remove a tracking pixel from their company website after reading our coverage. They might use our data as evidence in a report to advocate for change or report a local story based on data we published or introduce legislation to stop ongoing harms they learned about through a Markup investigation.
Cataloging these “impact events” can be onerous, repetitive work. In the last several months, we have devised an Airtable database that allows us to smoothly input, organize, and analyze impact, along with the stories that give rise to it and press coverage of our work. The ability to easily enter, cross-link, and analyze this data in Airtable allows us to have a fuller understanding of the reach and effect of every story.
Today, we are releasing an Airtable template of the structure of our impact database so that other newsrooms and organizations can readily adopt or build upon our impact-tracking process. Modeled on Resolve Philly’s customizable impact tracker, the template is prepopulated with the categories and tags we found most helpful at The Markup.
How We Think About Impact at The Markup
Although we aim for this template to be a widely useful tool, it reflects how we at The Markup specifically think about impact, including whom we aim to equip with the tools, knowledge, and agency to create change.
For every story, we consider four audiences that can drive change:
- People and communities directly affected by our investigation: What information can we give individuals or communities to equip them to protect themselves? For example, we can help them choose safer apps or more cost-effective internet providers.
- People who can make institutional change today: What information can we give people who work at the institutions causing or facilitating harm, specifically so they can fix problems using the power they have? For example, when we’ve identified the exact technology causing the problem, companies have immediately removed a tracking pixel from their websites that shares sensitive information.
- Lawmakers, regulators, advocates, and lawyers: What evidence can we provide to help this group establish the full scope of the harm and create policy or litigation that ensures the harm cannot be replicated? For example, we can give them the detailed information they need to fight for accountability, through class action lawsuits or direct requests from lawmakers for transparency.
- Fellow journalists: What data, access, and help can we provide journalists so that they can use or adapt our data to report local stories and so ensure the information we are sharing reaches all three audiences above even more deeply? For example, we share step-by-step story recipes that other journalists can follow.
We track impact by logging each time our reporting generates change by one of these audiences. If a company changes its policy as a result of our reporting, or a representative introduces new legislation and cites us, or an academic paper uses Blacklight—those are all examples of impact.
We also track press coverage of our articles to see which audiences our stories are reaching. However, we do not view republication or coverage of an investigation as impactful on its own. Instead, we see it as a means to an end: Press coverage from other outlets allows our reporting to reach a larger and more diverse audience, which can broaden the scope of an article’s impact.
When tracking impact, we are conscious of the importance of reader privacy. Everything tracked in our impact database has either been sent directly to someone on our team or is publicly available online. All data is stored in accordance with our privacy policy.
How to Track Impact in the Database
To better understand our database and how it might be useful to you, we will walk you through an example of how we use it to track an impact event.
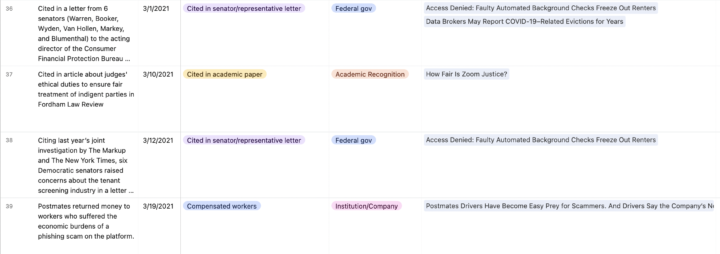
First, we click on the “Impact” tab and write a description about what impact occurred, choosing a category for the specific form of impact. For example, when Elizabeth Warren, Corey Booker, and several other senators cited our reporting in a letter to the acting director of the Consumer Financial Protection Bureau about tenant screening technology companies, that was categorized in the database as “Cited in a senator/representative letter.”
Next, we choose a broader, overarching category for the impact: The letter from the senators was placed in the overarching category “Federal gov.” Then, we also tag who changed their practices or will be impacted by the event. We can also tag the associated tool or investigative series that the impact event is related to (Locked Out, in this case). We tag the story that resulted in the impact in a field that is linked to the data in the “Stories” tab and can also tag if an impact story was published on The Markup about the impact event (as one was about the senators’ letter). We also can upload attachments (like a PDF of the letter) and links to refer back to in the future (like a link to Warren’s press release about the letter).
If the story related to the impact event was not already in our database, we add it in the Stories tab. We do this primarily so that all impact and press can be linked back to the corresponding story. We have tags to filter by the type of story (e.g. Explainer, Investigation, Newsletter, or Impact Article), tool used in the story (e.g. Blacklight), the topic the story is about (e.g. healthcare), or the series the story is part of (e.g. Pixel Hunt or Amazon’s Advantage). Since each story’s title, author(s), publication date, and link are logged, this information can be viewed as metadata if a story tag is clicked on in the Impact or “Press” tabs.
We took the time to enter all the stories we have ever published into our impact database, which has been useful for analyzing the composition of our newsroom coverage. We can now immediately find answers to questions like “How many articles have we co-published with a specific journalism organization?” or “How many stories have we written about accessibility?”
Other tabs in the database are useful for tracking activity related to impact but that are not impact events. We log any press coverage related to our stories in the Press tab, tagging the type of press (for example, local reporting of a story we published, republication of one of our stories, a citation of one of our stories, a podcast mention, etc.) and linking the associated Markup story from the Stories tab.
We keep track of stories published in partnership with other news organizations in the “Co-Publication” tab and keep track of awards we won or were finalists for in the “Awards” tab.
Several of the tabs, including those for tracking impact and stories, include an entry form as a convenient way to input new entries. New entries can also be added in the spreadsheet-like grid view.
Additional Notes About the Database
Every new story we publish is added to the Stories tab for tagging future press coverage or impact events. When some form of impact occurs, we either use the Impact tab or corresponding impact form to log information about it.
You don’t have to use all of the columns in our Airtable template when you log impact events or press coverage; you can fill out as many or few columns as you want. The template has the impact categories and tags we created to meet our needs, but you will likely want to edit them and add your own to reflect what matters to your newsroom. You can choose to only log articles when they generate impact—you don’t have to log absolutely everything.
No coding skills are required in order to maintain or use the database, so all of your staff members should be able to easily search for, filter, and sort data. We hope you find it to be a useful tool.
Have you changed your behavior or done something differently as a result of our reporting? If so, we would love to hear from you about it! Tweet or toot us, send us a DM on Instagram, or email us at: Hello@themarkup.org.