
Introduction
In 2014, a bombshell report from the University of California, Los Angeles, found that New York City had among the most segregated schools in the nation, and since then the city has been forced to look for answers on just how the situation turned so dire.
Like other American cities, schools in New York have a long history of segregation to reckon with, but one contributing factor has stuck out: New York City has the most-screened students in the United States according to The New York Times, and often those screens are most likely to filter out Black and Latino students, preventing them from accessing these publicly funded schools.
See our data here.
Applying to high school in New York City is an intense and convoluted process. The official 2020 NYC High School Admissions Guide is more than 100 pages long and includes activity worksheets on topics like how to identify which “priority group” a student is in. (In other years, the guide has exceeded 500 pages.) Students rank up to 12 programs, which use a variety of admissions methods ranging from random selection to the highly competitive (and controversial) Specialized High School Admissions Test (SHSAT), which students are required to take to gain entry into some of the city’s most selective schools.
In between the two admissions methods exist so-called “screened” schools. These schools use a wide range of criteria to rank students—things like auditions, attendance records, in-person interviews, and GPA and standardized test scores.
Media coverage has mostly focused on a handful of elite high schools that grant admissions based on SHSAT scores, but there are more than 100 others that use some type of screening to pick at least some of their students. While some academic “screens” are hardly a barrier—for example, the Middle College High School at LaGuardia Community College requires that students have minimum course grades of 65 out of 100, among other criteria—schools have much more stringent criteria. During the fall 2020 admissions cycle, for instance, Eleanor Roosevelt High School, on the Upper East Side of Manhattan had, in addition to other requirements, a minimum GPA screen of 94 out of 100, according to 2020 DOE High School Directory data found on NYC OpenData.

Some studies have looked at the relationship between school demographics and the school’s screening methods. A 2019 study by the Center for New York City Affairs at The New School found that screened high schools with the most difficult admissions criteria—GPA cutoffs of 85 out of 100 or greater, or standardized test score minimums of 3 out of 4.5—had student bodies that were 30 percent Black and Latino, compared to 60 percent of students at all screened schools.
Attendance requirements are some of the most popular screening criteria. Of the 75 fully screened schools we received data on, 64 had attendance or punctuality screens for the fall 2020 admissions cycle, according to city data. A 2019 report by the NYC School Diversity Advisory Group found that only 25 percent of Black and Latino applicants were able to meet attendance screen requirements, compared to 37 percent of White applicants and 61 percent of Asian applicants.
Reporters and the student activist group Teens Take Charge have highlighted individual screened schools for their disparate admissions rates. By contrast, we wanted to look at broader trends for the top-performing schools.
For four demographic groups—Asian, Black, Latino, and White—we looked at both the applicant and offer rates for the top screened schools, which we defined according to the New York City Department of Education’s own metrics. Of the 27 schools we identified as “best-performing,” we found that Black students had an admissions rate of 4.4 percent at top-ranked schools and Latino students had an admissions rate of 4.9 percent. White and Asian students had nearly double the admissions rates, at 9.2 percent and 8.6 percent, respectively.
Data Sources
Offer and Applicant Data
Our analysis is based on data from the New York City Department of Education (NYCDOE) in response to a FOIL request made by The Markup and THE CITY.
The dataset contains applicant and offer breakdowns for 75 New York City high schools during the fall 2020 admissions cycle. The 75 schools are considered “fully screened” by the NYCDOE—described by the agency as instances where “all programs at the school use a screened, audition, or Screened: Language & Academics admissions method” in the Notes section of the FOIL response.1 It does not include schools that have a combination of screened and unscreened programs that students can apply to, even if the screened school is popular among applicants. It does not include data on “specialized high schools,” such as Stuyvesant High School, which are the only schools in the city that use SHSAT scores to admit students. It also doesn’t include data on LaGuardia High School of Music and Art, which accepts students based on a combination of auditions and other criteria but is also considered a specialized high school.
The dataset includes the type of admission method(s) used by each school, the overall count of applicants and offers for the school, and descriptive counts for each demographic of applicants and offers.
In addition to race/ethnicity demographics, the dataset includes demographic information for students who are experiencing poverty, English-language learners, and students with disabilities.
Demographic information was not included for private school applicants.
The data is school level, meaning that applicants who applied to multiple programs at the same school are only counted once.
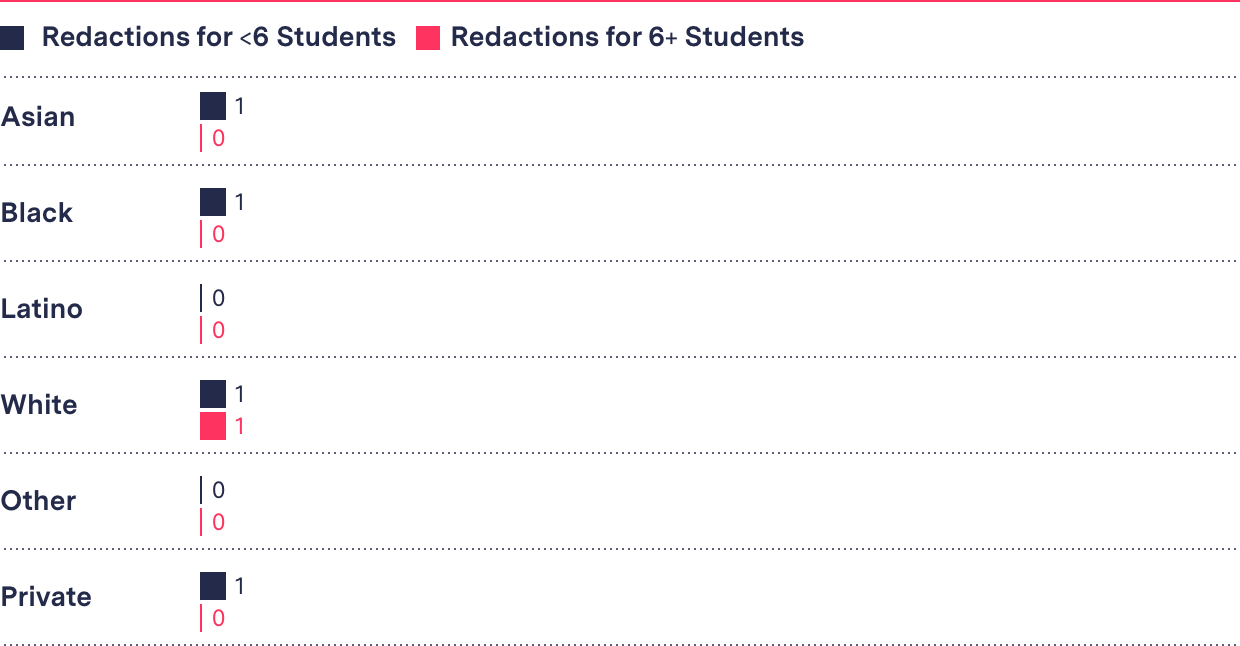
The NYC Department of Education redacted several entries in the dataset to protect student privacy. Some cells are marked as s, indicating that there are five or fewer students for that cell. Others are marked as s^, indicating that the redaction is for six or more students.
For the 75 screened schools we received count data for, we received data for 181,713 applicants. Out of these, only 18 student records were redacted from the race and ethnicity categories, or 0.01 percent of the total applicant counts.
Number of schools with redacted applicant cells
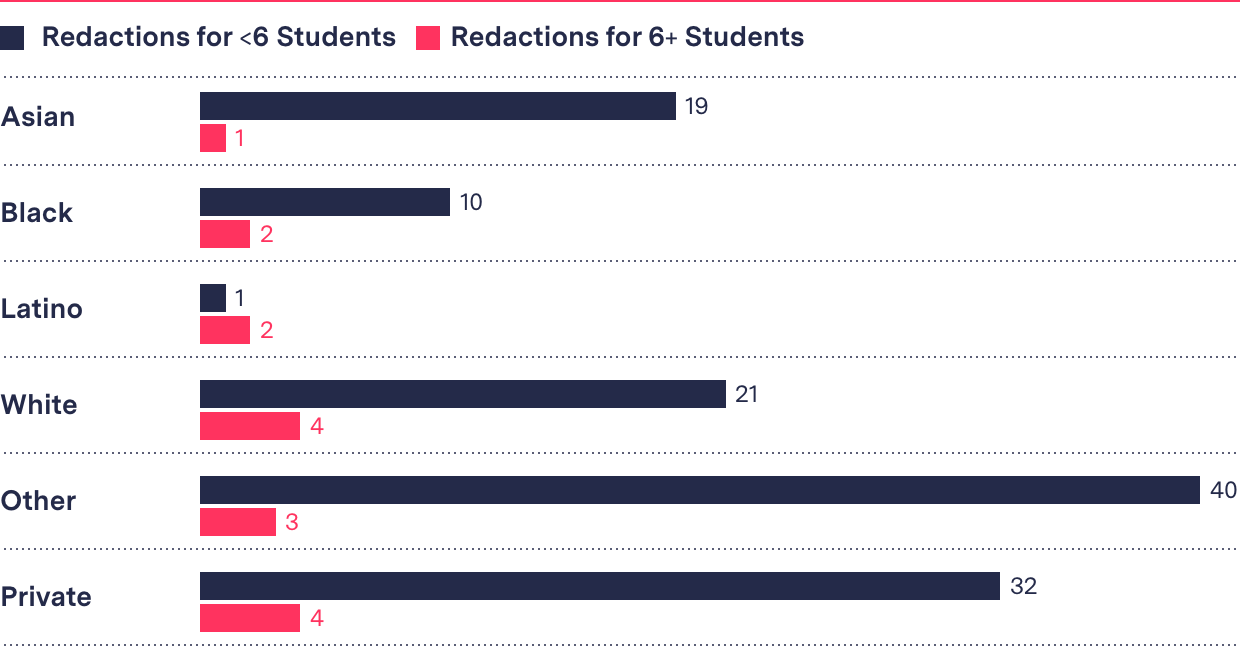
We received data for 15,427 offers from schools to admitted students. Out of these, 473 student records were redacted from the race and ethnicity categories, or 3.07 percent of the total count of offers. A large portion of redactions were for “Other” and “Private” demographics, which we did not include in our analysis.
Number of schools with redacted offer cells
In order to summarize rates for groups of different schools, we estimated a value for each redacted cell. For each redacted cell in both the applicant and offer data, we calculated the minimum and maximum possible value and took the midpoint.
For cells with s redactions, we estimated that the minimum possible count was 0 and the maximum possible count was either 5 or the amount of redacted students, whichever was smaller. For cells with s^ redactions, we estimated that the minimum possible count was 6 and the maximum possible count was the difference between the given “total” count and the sum of the unredacted counts.
School Rankings Data
The NYC Department of Education ranks schools on a variety of metrics, including things like the school’s four-year graduation rate, college readiness, and student performance on the New York State Regents exams.
For each school, the NYCDOE categorizes the school’s percentile rank according to this description found in the tool:
Color-coding rules:
- Blue (Far Above Average): The school's result was in the 85th–100th percentile.
- Light Blue (Above Average): The school's result was in the 75th–84th percentile.
- Light Red (Below Average): The school's result was in the 16th–25th percentile.
- Red (Far Below Average): The school's result was in the 0–15th percentile.
We defined uncolored cells as “Average.”
We used each school’s 2019 percentile rank category within the city for the following metrics:
- 4-Year Graduation Rate
- Avg. Regents Completion,
- Avg. Score: English (CC)
- Avg. Score: Algebra I (CC)
- CCPCI (Advanced Courses)
- College Readiness Index (no CAT)
The 75 screened schools skewed toward “Far Above Average” for each metric we examined.
Screened schools’ 2019 city rankings by metric
| Far Below Average | Below Average | Average | Above Average | Far Above Average | |
|---|---|---|---|---|---|
| 4-Year Graduation Rate | 1 | 1 | 16 | 15 | 41 |
| Avg. Regents Completion | 0 | 3 | 14 | 17 | 33 |
| Avg. Score: Algebra I (CC) | 4 | 1 | 20 | 13 | 30 |
| Avg. Score: English (CC) | 0 | 1 | 20 | 13 | 40 |
| CCPCI (Advanced Courses) | 1 | 1 | 20 | 10 | 42 |
| College Readiness Index (no CAT) | 1 | 1 | 16 | 10 | 46 |
We categorized a school as a “top-ranked school” if it was considered “Far Above Average” in five or more of the six metrics we examined. Twenty-seven schools, or 36 percent of the 75 screened high schools in our dataset were considered “top-ranked.” There were 107,326 total applicants for these schools, or 59 percent of the 181,713 overall applicants to schools featured in the dataset. There were 7,341 students accepted to these schools, or 48 percent of the 15,427 total students in the dataset who received offers.
Methodology
We sought to measure whether there were demographic differences between who was applying and who was getting into high-performing screened schools.
To do this, we joined the applicant and offer count data for the fall 2020 admissions cycle that we received in response to our FOIL request to the NYC Department of Education with the school ranking data we pulled from the NYCDOE’s School Performance Dashboard.
We calculated the admissions rates for Asian, Black, Latino, and White categories of students.
We found that Black students had an offer rate of 4.4 percent at top-ranked schools, and Latino students had an offer rate of 4.9 percent. White and Asian students had nearly double the offer rates, at 9.2 percent and 8.6 percent, respectively.
Offer Rates by Race/Ethnicity
| Schools | Total Applicants | Total Offers | Overall Offers (%) | Asian (%) | Black (%) | Latino (%) | White (%) | |
|---|---|---|---|---|---|---|---|---|
| All Screened Schools | 75 | 181,713 | 15,427 | 8.5 | 9.0 | 7.8 | 7.8 | 10.4 |
| "Top-Ranked" Screened Schools | 27 | 107,326 | 7,341 | 6.8 | 8.6 | 4.4 | 4.9 | 9.2 |
Because Black and Latino students had such a low offer rate compared to their White and Asian counterparts, the share of offers that belonged to Black and Latino students was lower than their share of the total applicants.
Percentage of applicants vs. offers for fall 2020 at “top-ranked” schools
| Applicants (%) | Offers (%) | Difference (%) | |
|---|---|---|---|
| Asian | 24.8 | 31.2 | 6.4 |
| Black | 16.5 | 10.7 | -5.8 |
| Latino | 27.2 | 19.4 | -7.8 |
| White | 19.0 | 25.4 | 6.4 |
Eleanor Roosevelt High School is one of the 27 “top-ranked” schools, and its disparate admission rates are stark. White applicants had an acceptance rate of 12.5 percent, double the school’s overall acceptance rate of 6 percent. Black students had an acceptance rate of less than half a percent. (Eleanor Roosevelt prioritized admission for students living in District 2, an especially White, wealthy part of the city. We don’t have district data for each applicant.)
The Special Music School is another one of the 27 “top-ranked” schools, and students must audition to gain admission to the high school. White students had an admission rate of 30.4 percent. Latino students had an admissions rate that was less than a third of that—8.3 percent of those who applied got in.
Our findings suggest that Black and Latino students are screened out of top-performing schools at a higher frequency than their White and Asian peers.
Limitations
There are limitations to our analysis. Our analysis includes only the 75 high schools that the NYC Department of Education considers fully screened, meaning that all of the programs within each school are defined as having a “screened” admissions process. We did not include schools that had any program with an admissions process that was not considered “screened,” even if that school would be considered a “top-ranked” school by our definition. The data is school level, meaning that applicants who applied to multiple programs at the same school are only counted once.
In its response to our FOIL request for applicant and offer counts for the fall 2020 admissions cycle, the NYCDOE redacted several entries in the dataset to protect student privacy. There were two types of redactions—one that indicated that the count of students was five or less for a cell, and one that indicated that the count of students was six or more. For these cells, we calculated estimated counts, meaning that our calculations are not perfect.
Additionally, demographic information was not available for applicants coming from private schools, meaning that our analysis does not take those applicants, and whether or not they were admitted, into account when calculating rates for each racial/ethnic demographic.
While we have insight into the beginning and end of the selection process—who applied, and of those, who got in—we do not have data on how each individual applicant’s qualifications stood up against a school’s screening requirements. We also don’t have information about what priority group2 an applicant might have been in or how high an applicant ranked each school on their list of choices, all of which can affect whether or not a student was eventually admitted.
Our definition of “top-ranked” schools is based on the NYC Department of Education’s own metrics and rankings, but is by no means a definitive list of top-ranked schools.
School System Response
The NYC Department of Education did not dispute our findings but assured The Markup that efforts to improve admissions equity were underway.
“We continue to remove barriers and make our school system more equitable and we’re always exploring ways to build on the promising results we’ve seen already,” Katie O’Hanlon, a spokesperson for the department, said in a statement. “The recent admissions changes are driven by the best interest of our students and, while we know there is more work to do, we won’t stop working to bring real, lasting change to our public schools.”
O’Hanlon told The Markup that the city has prioritized community engagement, including with disadvantaged families, to create a fairer system. But the data shows the potential limits of engagement alone. A similar number of Black and Latino students applied to the best-performing schools we looked at, compared to other demographics. They were just less likely to get in.
The city and state have also provided funding to some districts to develop diversity initiatives, O’Hanlon pointed out. More than 100 schools are part of the city’s “Diversity in Admissions” program, in which schools pledge to give priority to disadvantaged students. But only 10 of the 75 screened schools we looked at were part of the program, according to city data.
Conclusion
We found that during the fall 2020 admissions cycle, Black and Latino students were screened out of “top-ranked” schools at higher rates than White and Asian students. Of the 27 schools we identified as “top-ranked,” we found that Black students had an admissions rate of 4.4 percent, and Latino students had an admissions rate of 4.9 percent. White and Asian students had nearly double the admissions rates, at 9.2 percent and 8.6 percent respectively.
The school system is already changing.
Late last year, after the fall 2020 admissions cycle concluded, Mayor Bill de Blasio announced changes to the screening system in the city. Middle schools, he said, would “pause” using screens for the upcoming school year and reevaluate the following year. High schools, he announced, would permanently phase out the use of geographic priority screens, which favor admission for students living in certain parts of the city and can disproportionately lock students of color out of schools in White areas.
It was a decision largely driven by the pandemic, which caused schools to temporarily abandon measures of achievement like test scores and attendance for the year. The effects of these changes will be possible to observe using fall 2021 admissions cycle data.
See page 25 of the 2020 NYC High School Admissions Guide for a breakdown of New York City high school admissions types.
↩︎ back