
In Detroit, residents know that their sky-high car insurance prices shape almost every aspect of Motor City life. The average cost of auto insurance is $5,300 a year, the highest of any major American city. Median household income is under $38,000, meaning the typical Detroit family spends nearly 1 out of every 7 dollars on car insurance.
Our investigation, which looked at recent insurance rate filings from the state’s seven largest auto insurers, showed Michigan’s 2019 reform law continued to allow insurers to use customers’ non-driving factors, like their home address, in setting rates. Policyholders in areas with more Black residents, particularly in the city of Detroit, were consistently charged more for car insurance than if they had lived anywhere else in the state.
Background
Almost every state requires drivers to have some form of auto insurance. How much that insurance costs, however, can vary significantly between drivers, even if the policies offer identical coverage.
Insurance companies set the premium policyholders pay based on an assessment of how expensive it would be to cover the customer. Common factors insurers use to assess a customer’s risk of filing costly claims include age (a 16-year-old driver pays more than a 50-year-old), driving history (someone responsible for multiple crashes pays more than someone with a clean record), and how much the car is used (someone who drives 15,000 miles a year pays more than someone who drives half that).
Almost all states ban or restrict how insurers can use race, religion, and national origin, and many put additional controls on other factors. A company’s business considerations, such as the likelihood that a customer would switch to a competitor following a premium hike, has been explicitly prohibited as a potential factor by many states across the country.
In 2019, Michigan passed a law banning insurers from setting rates using sex, marital status, homeownership, educational level attained, occupation, credit score, and the postal zone (namely, zip code) in which the insured resides. The idea was “to facilitate the purchase of that insurance by all residents of this state at fair and reasonable rates.” However, an examination of documents submitted after the law was implemented clearly shows how it allows insurance companies to skirt the spirit of many of these prohibitions.
For example, while the state banned the use of credit scores, it still permits insurance scores, which use much of the same information and are produced by some of the same companies that create credit scores. A review of documents submitted by all of the insurers in our investigation found that none used credit scores prior to the prohibition, only insurance scores.
The law prohibited using zip codes but held that “automobile insurance risks may be grouped by territory.” Our disparate impact analysis focuses on the consequences of allowing territory groups while prohibiting the use of zip codes—a system that continues to leave the state’s Black neighborhoods, especially in the Detroit area, paying far more for car insurance based solely on where they live.
See our data here
Since our analysis is a disparate impact analysis, we looked at the overall disparities between the outcomes (in this case, the approximate cost of car insurance premiums based on location) for different demographic groups. We found that Michigan’s Black population was disproportionately clustered in parts of the state being charged the most expensive car insurance.
To be clear, our reporting has not found evidence of disparate treatment; in other words, we have not found evidence of insurance companies charging higher rates in predominantly Black neighborhoods explicitly because of their racial makeup. Definitively answering questions about disparate impact based on insurer’s prior loss histories was also beyond the scope of our analysis.
Methodology
Insurer Selection
Our analysis focused on the insurance companies that play the largest roles in Michigan’s insurance market. To identify these companies, we used data from a professional association for insurance regulators, the National Association of Insurance Commissioners (NAIC), which puts out an annual report on insurer market share in every state. We identified the seven companies with the largest market shares in Michigan’s total private passenger auto insurance market from the most recent NAIC report in 2022.
Rate Order of Calculation
Insurers determine premiums by running each policyholder’s personal information through a “rate order of calculation,” which begins with the base rate for each coverage type (e.g., liability, comprehensive, and collision, among others).
The base rate is then adjusted up or down according to different rating factors by multipliers called “relativities.” For example: A relativity of 1.07 on collision coverage would raise that part of the base rate by 7 percent, and a relativity of 0.93 would decrease it by the same amount. The insurance companies we examined listed up to around 75 different rating factors.
A customer’s premium can be calculated by adding up the values of each of their coverage types using the initial base rate and applied rating factors. Some insurers use location to determine their base rates; others apply location relativities to their base rates. Some insurers use location in both their base rates and relativities. See Calculating Location Effect for examples.
Gathering Insurance Rate Filings
Insurance companies across the country are required to submit rate filings to state-level regulators, like Michigan’s Department of Insurance and Financial Services (DIFS), detailing the different factors they use to set premiums and provide “actuarial justification” proving that these factors are related to their risks of incurring losses from claims.
Those rate filings, which form the basis of our analysis, are publicly available on the NAIC’s System for Electronic Rates & Forms Filing (SERFF).
We gathered and read the latest filings from each selected insurer with special attention to any rate adjustments related to location and other protected characteristics mentioned in Michigan’s 2019 insurance reform law, like education level and marital status. (See Other Circumvented Prohibitions.)
In addition to the most recent filings, we also gathered Allstate and Liberty Mutual rate filings from shortly before Michigan’s reform law went into effect. Out of the seven insurance companies we looked at, only Allstate and Liberty Mutual had enough clear data to conduct a comparison of their policies before and after the 2019 reform law.
Data Extraction
After identifying the companies we wanted to examine, we downloaded their rate filings for private passenger auto insurance from SERFF’s Michigan database. We used the database’s search function to locate filings for private passenger autos submitted from May 2022 through August 2023. This was the time frame most likely to yield data to compare policies across different insurers that have had time to adjust to the post-reform rules.
We only looked at filings already approved by DIFS to avoid analyzing filings still undergoing review that the regulators could later reject or the insurers withdraw.

We then reviewed filings until we found each insurer’s rate calculation table, which lists the factors used to determine premiums, as well as the supporting documentation detailing what inputs each factor uses to adjust a customer’s premium. From there, we cross-referenced every factor with its description elsewhere in the filing, logging its purpose and whether it appeared to circumvent the spirit of a prohibition imposed by Michigan’s 2019 reform law. We specifically looked for references to gender or sex, marital status, homeownership, highest level of education, occupation, territory or location, and credit-based information, like insurance scores. (See Other Circumvented Prohibitions for information on what we found for other categories.) Every insurer we analyzed used location in setting premiums. Finally, we extracted data for base rates and location-based relativities.
Calculating “Location Effect”
An insurer’s base rates, whether constant or dependent on vehicle type or location, formed the starting point of our calculations. Allstate and Liberty Mutual set base rates using location (we call these location-fixed base rates). The remaining insurers used either (a) values tied to the type of vehicle insured or (b) the same set of base rates for all policyholders, and then applied relativities based on location (we call these location-adjusted base rates). (See Rate Order of Calculation for more information on base rates.)
We estimated the effect a driver’s address had on their premium by comparing our calculation of an insurer’s location-fixed or -adjusted base rate for each territory with the median rate of all of that insurer’s territories. We refer to this ratio as a territory’s location effect. In short, the location effect is a territory’s base rate, inclusive of any location-related factors, indexed to the insurer’s median rate.
Location effect then allowed us to isolate the significance an area has on a customer’s premium while holding other factors constant. For example, the change in location effect between Detroit and Traverse City, Mich., shows the estimated gap between how a driver’s rate is adjusted for Detroit and how the same driver’s rate would change if they lived in Traverse City for the same car insurance plan.
Since the location effect only incorporates the elements of a premium directly impacted by a policyholder’s address, it is not indicative of the final rate a customer would be asked to pay, which could be higher or lower depending on other factors involved. (See Limitations for more information.) Thus, location effects cannot be used to estimate the proportional difference of the total premium price an individual driver would pay between two different locations in Michigan for the same car insurance plan.
Determining Geographic Units for Demographic Analysis
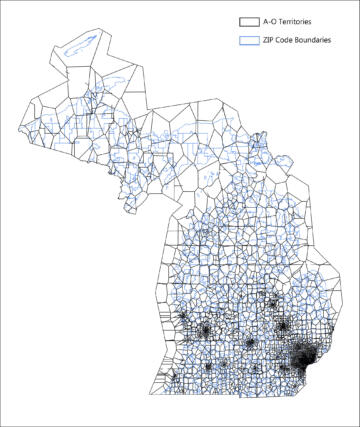
For every insurer we examined, we found either a base rate or rating factor that incorporated a customer’s address as part of setting premiums. Each insurer grouped customers’ locations in a different way: Some insurers used government-defined geographic units, while others produced custom points or boundaries.
The U.S. Census releases individual and household data on race, income, and other demographic characteristics aggregated to various geographic boundaries, such as counties, census tracts, block groups, blocks, and zip codes. For zip codes, we used zip code tabulation areas (ZCTAs), a Census-created aggregation.
To analyze the effects of location in determining insurance rates for various populations, we used appropriate Census boundaries when identified by an insurer or determined the best-fitting geographic boundaries for an insurer’s custom-made territory maps. For the latter analyses, we measured the internal variation of the location-fixed or -adjusted base rate for each set of boundaries after calculating the location effects for an insurer’s territories. We ran our final analyses on the boundaries that minimized internal variation.
Two insurers, Allstate and State Farm, made custom gridded maps to set relativities. These maps divided the state into grids of equal-area units. For gridded maps, we attempted to match the territories to census boundaries based on our estimates of the effect the territory’s location had on premiums.
After identifying companies’ geographic units, we found their corresponding race and income demographics in the Census’s 2022 5-Year American Community Survey (ACS).
Nearest Neighbors
We ran a “nearest neighbor” analysis to investigate how different territory systems rate policyholders who live near each other. We compared each territory’s location effect with the territories bordering it.
We paid special attention to territories along 8 Mile Road, the northern boundary of Detroit that separates the city from the metro area’s suburbs. For 8 Mile, we compared each area within a mile of the road because, for multiple insurers, the largest local difference in location effects occurred when crossing the road.
Quintile Distributions
We sorted each insurer’s territories into quintiles based on location effect. We used quintiles to approximate the same number of territories in each group.
We repeated this for median household income and population density, categorizing each area into quintiles when the data was available. (See On Median Household Income and On Population Density.)
How the Location Loophole Can Result in Black Areas Paying Even More
Michigan’s 2019 reform legislation banned the use of “postal zone” but contained a significant loophole: “Automobile insurance risks may be grouped by territory.” Prior to the change, most, but not all, of the insurers we examined used some form of zip code to divide up the state. Following the reform law, insurers using the now-prohibited method switched to geographic units that divided nearly a thousand zip codes into a smaller number of units (Liberty Mutual’s 83 counties) or a much larger number of units (State Farm’s 176,688 gridded territories). (See Appendix: Table A. Pre- and Post-Reform Filings.)
Forcing insurers to abandon the use of zip codes may have opened the door to more precise mechanisms of charging different rates to different demographic groups. While they have historically been used to group people by area, zip codes were created by the U.S. Postal Service as a way to sort mail for delivery, not for demographic research or analysis.
The U.S. Census Bureau primarily aggregates data in units it creates, like blocks, block groups, or tracts. Since zip codes are technically categorization criteria for addresses, they are not, on their own, geographic areas with boundaries. The Census Bureau transforms zip codes into ZCTAs by joining groups of census blocks based on the most prevalent zip code for each block, meaning demographic data for zip codes is an approximation of the data initially collected at the block level.
Thus, replacing zip codes with smaller and more numerous geographies can allow for more precise targeting of an area’s demographic features.
Findings
On average, 64 percent of Black Michiganders lived in territories within every insurer’s highest quintile of location effects. These territories saw a location effect between 10 percent and 360 percent above an insurer’s state median. No matter which of the top insurers they chose, most Black Michiganders had premiums that were set higher based solely on where they lived.
We observed a strong correlation between race and location effect for two insurance companies, Auto Club and Citizens. As the number of Black residents in a territory increased, the location effect tended to increase for both insurers. We saw a similar but opposing trend with Michigan’s White population: As the number of White residents in a territory increased, the location effect generally decreased. For those two insurers, only 7 percent of White Michiganders lived in areas with the top quintile of location effects.
We did not find conclusive evidence of any correlation, or lack thereof, between race and location effect for Allstate, Liberty Mutual, and State Farm.
Insurers concentrated the state’s highest rates in Detroit. Auto Club had the widest range of location effects within the city. It was the only insurer that had a Detroit territory with a location effect below the company’s statewide median. It also had one of the two strongest correlations between race and location effect across Michigan among the seven insurers. Auto Club set higher location-related relativities in territories with a higher Black population and lower location-related relativities in territories with a higher White population.
Insurers Using Location-Fixed Base Rates
Allstate
Allstate divided Michigan into a grid of 78,015 territories for its location-fixed base rates. Each territory, or “location zone,” as Allstate called it, was named using a set of geographic latitude and longitude coordinates. According to a company filing, each coordinate represented the central point within a square approximately 1 mile wide and 1 mile across. A customer’s location zone was assigned based on which gridded area enclosed their address’s geographic coordinates.
The insurer’s filings also included a territory-based supplementary rate calculation table to adjust rates based on how long a customer was covered under their previous insurer. We excluded this supplementary calculation because it only applied to a subset of the state and was not strictly tied to a customer’s address.
To determine the best fit for matching demographic data on race and income, we merged each territory to the block, block group, ZCTA, census tract, and county it fell within. Blocks and block groups left over 80 percent of the state’s population without an Allstate insurance territory. Tracts left 10 percent of the population without a territory match. ZCTAs both minimized the internal variation of location-adjusted base rates and retained 100 percent of populated areas. Therefore, we matched Allstate’s territories to 2022 ACS demographic data by ZCTA.
Before the 2019 reform that prohibited the practice, Allstate divided Michigan by zip code in its location-fixed base rates. Pre-reform, about 1 in 4 residents lived in a top quintile area. This included 67 percent of Black Michiganders and 19 percent of White Michiganders. Michigan’s population is 74 percent White and 13 percent Black.
After the reform, the median location effect for majority-Black ZCTAs was 40 percent higher than the statewide median and within the top 6 percent of all territories. The median location effect in majority-White ZCTAs was on par with the state median. Thirty-four percent of Michiganders lived in a ZCTA where the typical location effect was within the top quintile of the state. Sixty-nine percent of Black residents lived in that top quintile, compared to 28 percent of White residents.
There was also a significant disparity between Detroit and the rest of Michigan. The median location effect in Detroit, which is 76 percent Black, was more than double the statewide median. The lowest location effect within Detroit was higher than 99.4 percent of all other location zones in the state. Less than 1 percent of the state’s territories fell within the range of rates calculated for Detroit.
Allstate’s highest location-fixed base rates were for customers in Detroit’s Morningside neighborhood, where the location effect was more than triple the company’s statewide median. The territory, within the 48224 ZCTA, is 88 percent Black and has a median household income of $41,011, which is slightly higher than that of the city of Detroit and about 40 percent lower than the state median of $68,505.
Allstate’s lowest location-fixed base rates were near Mattawan, Mich., in an area spanning the 49009 and 49071 ZCTAs. The location effect there is 33 percent lower than than the statewide median. The two ZCTAs are 79 percent White with household incomes 50 percent higher than the state median.
Performing a nearest neighbor analysis showed that, on average, Allstate set rates for a territory similar to those of its surrounding neighbors. In the filing that introduced replacing zip codes with gridded territories, Allstate said the new base rates are calculated using the land-area weighting of the previous zip code rates to mitigate major changes to customer’s rates. The territories that had noticeable differences in location effects were typically areas along ZCTA boundaries. When we filtered for where an adjacent territory increased the location effect by at least 10 percent, 84 percent of those territories were along a ZCTA boundary.
Liberty Mutual
Liberty Mutual divided the state up by county for its location-fixed base rates. We matched 2022 ACS demographic data by county for our analysis.
Liberty Mutual had the fewest and the largest territories of any of the insurers we examined. Despite less dramatic differences in location effect among the insurers we analyzed, Liberty Mutual still showed comparatively higher location effects in Michigan’s more populous, diverse, and Black counties.
County-adjusted base rates remove the potential for adjacent neighborhoods within a county to show significantly different location effects corresponding to demographics.
Before the 2019 reform that prohibited the practice, Liberty Mutual divided the state by zip code to assign base rates. Before the reform, 34 percent of residents lived in a ZCTA in the top quintile of location effects: This included 74 percent of Black Michiganders and 26 percent of White Michiganders. After the reform, about 50 percent of the state’s residents lived in counties with location effects in the top quintile of the state. This included 76 percent of Black Michiganders and 41 percent of White Michiganders, meaning more White residents are paying higher prices than before, but a much larger share of Black residents still lived where car insurance costs were the highest.
The largest gap in location effect was between Wayne County and both Midland and Isabella counties. Two majority-White counties in central Michigan, Midland and Isabella border each other and showed a location effect half that of Wayne County, the state’s most populous and diverse county.
Wayne County, one of six counties within the greater Detroit metropolitan area, is about 40 percent Black and has Liberty Mutual’s highest location effect. Its location effect was 50 percent higher than the statewide median and about 14 percent higher than that of Genesee County, where we observed the second-highest location effect in the state. Genesee County, which encompasses the city of Flint, has the state’s second-largest percentage of Black residents; about 1 in 5 residents are Black.
Insurers Using Location-Based Rating Factors
Auto Club
Auto Club used 2010 census tract geographies to set territory boundaries for its location-based rating factors. To match on 2022 demographic data, we downloaded racial demographic counts from the 2022 ACS by block group and used weights from the National Historical Geographic Information System (NHGIS) to interpolate the counts to 2010 census tracts. (Census tract boundaries are typically updated to reflect the most recent decennial census. Current demographic data must be interpolated to historical boundaries using crosswalks.) We could not join recent median household incomes to 2010 census tracts, because NHGIS’s crosswalk methodology cannot be directly applied to medians.
Auto Club exemplified what happened when policy banned the use of zip codes while leaving the door open for more precise tools. (See How the Location Loophole Can Result in Black Areas Paying Even More.) Census tracts are more precise, averaging 4,000 residents, than the areas covered by ZCTAs, which are approximations of point-based zip codes designed for delivering mail and varying in size, shape, and population. As the proportion of Black residents increased in an Auto Club territory, its location effect typically increased. Conversely, as the proportion of White residents increased in a territory, its location effect generally decreased.
This trend was, on average, more evident within Wayne County than throughout the state at large: There was a strong correlation between a larger Black population and higher location effect, and a stronger correlation between a larger White population and lower location effect.
Fifteen percent of Michigan residents lived in territories showing location effects among the highest quintile in the state. About 7 percent of White Michiganders and 58 percent of Black Michiganders lived in these territories.
We observed the starkest gaps in location effect on or near Detroit’s borders, which also had the highest location effects in the state. For example, take the four territories in the southwest corner of Detroit near Dearborn. These territories, showing a location effect of nearly triple the statewide median, spanned the Joy Community, Garden View, and Fiskhorn neighborhoods. The Joy Community and Garden View tracts were more than 90 percent Black, and the Fiskhorn tract was 78 percent Black.
We found the largest gap in location effects in the state between those four territories and a neighboring territory that included Stoepel Park and Erma Henderson Academy. The Stoepel Park territory is 86 percent Black and was a major outlier in Detroit, with an effect on par with the statewide median. It is not clear why that territory is an outlier compared to its neighboring territories with similar demographic profiles.
All other Auto Club territories in Detroit showed location effects at least 40 percent higher than the state median.
At the eastern end of Detroit, the territories containing the Jefferson Chalmers and Morningside neighborhoods showed location effects that were double that of Grosse Pointe Park, which sits outside Detroit’s borders. The Detroit territories ranged from 75 percent to 91 percent Black, while Grosse Pointe Park was 84 percent White. Median household income in the Detroit neighborhoods ranged from 25 percent of the state median to just below the state median. Median household income in Grosse Pointe Park was nearly double the state median. A five-minute drive separates these areas.
A similar gap in location effect is observed about a mile north; Detroit’s Cornerstone Village (84 percent Black) showed a location effect 50 percent higher than that of Grosse Pointe Farms, the city directly bordering it. Grosse Pointe Farms, home to the Detroit Country Club, was 90 percent White, with a median household income of $156,000, more than double the state median. The median income in Cornerstone Village is on average $30,000, about half the state median. It takes less than 10 minutes to drive between these two areas.
Auto Club set location-adjusted base rates about twice as high in two westside territories, just south of 8 Mile, than it did for their neighboring territories in Hazel Park, just north of the road. The westside territories are 86 percent Black, while Hazel Park’s are 71 percent White. The median household income in the Hazel Park tracts is about on par with the state median and 75 percent higher than the median income in the westside territories.
Citizens
Citizens used 2010 census block group geographies, the smallest census geography—smaller than the census tracts used by Auto Club—to divide the state for its location-based rating factors. We downloaded racial demographic counts from the 2022 ACS by block group and used weights from NHGIS to interpolate the counts to 2010 census block groups.
Citizens assigned customers a market discount code between 1 and 99,999. The code is a composite score calculated using multiple factors, including number of address changes, insurance score, driving history, prior insurance status, and vehicle history. Depending on a customer’s market discount code, they are assigned one of two location-based rating factors. Across the board, we used the smaller location-based rating factor to be as conservative as possible.
The insurer’s territory rating system was similar to Auto Club’s. Both insurers used census-defined boundaries; for most territories, as the proportion of Black residents increased, so did its location effect. Likewise, as the proportion of White residents in territory increased, its location effect generally decreased.
Fifteen percent of residents lived in territories with the highest location effects (top quintile) in the state. Seven percent of White Michiganders and 57 percent of Black Michiganders lived in those most expensive territories.
Inside Wayne County, home to the city of Detroit, almost half the residents lived in a territory with a location effect in the top quintile of the state. Twenty percent of the county’s White residents and 85 percent of its Black residents lived in one of these territories. Wayne County also aligned with the statewide trend of higher location effects for block groups with higher Black populations. The county also showed a significantly stronger trend of White block groups with lower location effects than the state as a whole.
Fewer than 30 block groups showed location effects more than 50 percent higher than an adjacent block group’s location effect, so it is unlikely that a Citizens customer’s rate would be significantly different if they lived in a nearby neighborhood.
These few areas were also distributed throughout the state, and not concentrated mostly in Detroit in contrast to other insurers. For example, the northwest corner of Pontiac, Mich., showed a location effect 60 percent higher than those of its bordering suburbs. This corner of Pontiac is 35 percent White and 45 percent Black, with median household incomes ranging from $13,000 to more than $100,000 a year. The neighboring suburbs are 82 percent White, with median household incomes around $95,000.
In the southwest corner of Michigan, the territories east of the St. Joseph River in Benton Harbor showed location effects almost double that west of the river in the city of St. Joseph. Benton Harbor is over 66 percent Black. St. Joseph is 83 percent White. It takes three minutes to drive across the Bicentennial Bridge from the post office in Benton Harbor to that of St. Joseph.
We did not match on median household income for Citizens’ territories, because NHGIS’s crosswalk methodology is intended to weight total counts and cannot be directly applied to medians.
State Farm
For its location-based rating factors, State Farm divided the state into a grid of 176,725 territories, the largest number of any insurer, which also meant its territories were the most microtargeted out of all seven insurers. State Farm created 2.3 times the number of territories as Allstate, which had the second-highest number of territories. State Farm territories were labeled using a “gridded id” containing latitude and longitude coordinates, spaced out at roughly a mile apart.
After filtering out 1,289 territories that fell within Wisconsin, Indiana, Ohio, and Canada, we overlaid block, block group, ZCTA, census tract, and county boundaries to determine the best fit to match demographic data.
We could not clearly determine corresponding census geographies to State Farm’s gridded territories. ZCTAs and tracts grouped over 2,200 territories within a single ZCTA or tract. Blocks and block groups grouped a maximum of 200 territories but subsequently left 69 percent of the state’s population without a State Farm territory. We chose to match territories to tracts because they were the smallest geographic unit with racial demographic data that minimized both the internal location effect variance and the number of census boundaries that did not contain a coordinate representing an insurance territory.
For the nearest neighbor analysis, we merged territories to blocks to minimize the number of adjacent territories matched onto the same demographic data. However, we merged territories with median household income at the block group level because the ACS does not release income data at the block level.
Among all insurers, State Farm had the widest gap between the lowest and highest location effects across the state of Michigan. State Farm set its highest location-adjusted base rates in Detroit’s Morningside neighborhood, which is 97 percent Black. Its location effect was nearly seven times that of the territory with the lowest location effect in the state, somewhere in the southeast corner of Washtenaw County’s Saline Township. The township is 90 percent White and has a median household income 50 percent higher than the state median.
Like other insurers, State Farm’s location effects in Detroit were significantly higher than the rest of Michigan. The lowest location effect in Detroit was double the lowest effect statewide and 40 percent higher than the state’s median effect.
We found one of the starkest examples of the fine-grained price-setting along 8 Mile. We matched each State Farm territory within 1 mile south of the road to its nearest neighboring territory north of 8 Mile. The territories directly south of the road were 88 percent Black and 7 percent White, while the territories north were 50 percent Black and 39 percent White.
Eighty percent of territories south of 8 Mile showed location effects higher than their northern counterparts. Half of those territories showed location effects at least 50 percent higher than their nearest territory north. When territories south of the road showed location effects lower than their northern counterparts, the differences were, on average, 10 percent lower. Each of the adjacent territory pairs we compared along 8 Mile were a 5- to 10-minute drive from the end of one to the other.
Four State Farm territories within a mile south of the road showed location effects twice that of their nearest neighbors north of the road. These neighborhoods south of 8 Mile are all at least 60 percent Black, while their nearest neighborhoods north of 8 Mile were all majority White and less than 10 percent Black.
For example, a territory in the Grixdale Farms neighborhood showed a location effect more than double that of a territory in the city of Ferndale, north of the road.
The location effect in Grixdale Farms, which is within a census block that is 73 percent Black, was more than triple the State Farm’s statewide median. The location effect in the Ferndale territory, located within a block that’s 77 percent White, was 40 percent higher than the median. Median household income in the Ferndale territory is close to the state median and about twice that of Grixdale Farms.
About a mile and half west of Grixdale, a territory in a University District neighborhood block, which is 61 percent Black, showed a location effect double that of a territory in a Ferndale neighborhood block that is about 84 percent White. Both territories are in block groups with median household incomes more than double Detroit’s and at least a third higher than the state median. The University District neighborhood’s median household income is about 20 percent higher than the median income in the Ferndale neighborhood. The Ferndale neighborhood’s location effect is about 44 percent higher than the median effect, while the University District’s effect is triple the median effect.
On average, the location effects directly south of 8 Mile were about 40 percent higher than the location effects just north of the road. These gaps were also observed between majority-Black neighborhoods on both sides of 8 Mile. A territory in Detroit’s Greenfield neighborhood showed a location effect more than triple the statewide median, while a territory in the Oak Park neighborhood north of the road showed a location effect more than twice the statewide median. Both neighborhoods are more than 80 percent Black and have median household incomes around half of the state median. These areas are about a 10-minute drive from each other crossing the Detroit boundary line.
Seventeen percent of Michigan residents live in tracts with location effects in the top quintile of the state. This includes 62 percent of Black Michiganders and less than 10 percent of White Michiganders.
All of State Farm’s territories in Detroit showed location effects within the top quintile of the state. Furthermore, 90 percent of territories in all of Wayne County showed location effects in the top quintile of the state.
Other Insurers
Auto-Owners
We were unable to analyze Auto-Owners’ territory-based relativities for adjusting premiums. We could neither reliably identify the boundaries to existing maps nor match the rate table location identifiers to the map’s geographic areas.
Auto-Owners divided the state into 4,205 custom-made territories. We extracted the territories from a PDF in a company filing.
We hypothesized that Auto-Owners’ territory map was a Voronoi diagram produced using preexisting geographies. We were able to reproduce many of the territory boundaries by constructing a Voronoi diagram with the central points in Michigan’s census tracts. There were some territory boundaries that failed to match up with our reproduction; the boundaries that failed to match Auto-Owners’ map usually lined up with a county border.
Using census tract information, we tried to line up the territory label names with census tract identifiers. Each territory code was prefixed with a county code like census tract identifiers, but the suffix identifying the tract failed to match. The insurer’s territory codes often failed to match the number of tracts for a given county.
Progressive
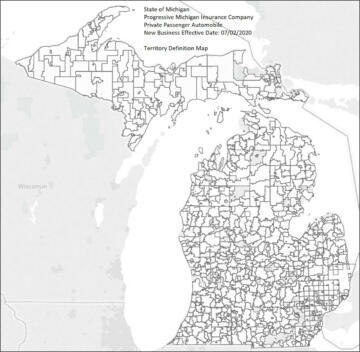
We did not analyze Progressive’s territory-based rating factors, because we were unable to reliably match its territories to preexisting geographic boundaries. Progressive divided the state into territories labeled using a “location name,” grouped using “territory codes” corresponding to relativities.
We overlaid ZCTA, county, and municipal boundaries on top of an image of the insurer’s territory map from documentation Progressive submitted to DIFS. The map’s boundaries largely matched up to a combination of ZCTA and municipal boundaries. Additionally, more than 200 location names matched the name of a city or unincorporated area. Despite these matches, we could not reliably determine the accuracy of a geographic or name match, because there were conflicting matches from different datasets.
On Median Household Income
We also analyzed the relationship between location effect and median household income. We split the data into income quintiles and then calculated the distribution of each income group within each corresponding location effect quintile. We were able to match income data for Allstate, Liberty Mutual, and State Farm, but not for Auto Club or Citizens.
For Allstate and Liberty Mutual, the territories in the top quintile of location effects were divided approximately evenly across income levels.
For State Farm, however, we found that half of its lowest-income territories had the highest location effects. Additionally, 29 percent of the highest-income territories had the lowest location effects. Out of all five income quintiles, the highest-income territories had the largest percent of low location effects.
On Crime (Added July 30, 2024)
Following publication of our investigation, readers asked whether Detroit’s elevated rates of vehicular crime, like break-ins or auto theft, were a major factor for high insurance rates in the city.
We can answer this question because the types of insurance coverage that pay out for damages following a vehicular property crime can be identified and evaluated separately from other types. If crimes were the major driver of differing insurance prices across the state, we would expect those differences to disappear when the coverage types relating to crime were removed from our calculations.
We ran an analysis excluding the types of insurance coverage that pay out in the event of crime-related claims, such as comprehensive coverage, car rentals, and roadside assistance. We found little to no change in the racial demographic distribution between location effect quintiles for every insurer, except Liberty Mutual. Across all insurers, when factoring out those coverage types, 65 percent of Black Michiganders, on average, lived in the top quintile of location effects.
For Liberty Mutual, removing crime-related coverage shifted a larger percent of Michiganders into the highest quintile territories. Our new analysis increased the percentage of Black Michiganders living in the highest location effect quintile from 76 percent to 81 percent. Notably, the percentage of White Michiganders living in the highest location effect quintile also went up from 41 percent to just over 50 percent, the only instance in our analyses in which we observed the majority of the state’s White population living in the top quintile.
There was insufficient public crime data to directly incorporate vehicular crime rates into our analysis. Auto theft and break-in reports collected by hundreds of local law enforcement agencies in Michigan are not readily available to the public. In addition, according to the Bureau of Justice Statistics’ National Crime Victimization Survey, around 20 percent of motor vehicle thefts across the U.S. were not reported to law enforcement in 2022, meaning official police statistics are not fully reflective of the true underlying auto crime rate. Other survey data released by the agency suggests different demographic groups may report crime victimizations to police at different rates, making it difficult to directly compare how people in different communities are affected by vehicular crime using official crime statistics.
On Population Density
In response to our analysis, Auto Club, Citizens, Liberty Mutual, and the Michigan Department of Insurance and Financial Services cited population density as a key factor in assessing risk and setting higher rates in urban areas.
To test whether population density explained the differences we found in insurance rates across Michigan, we took two approaches.
First, we analyzed whether a large share of each insurer’s most populated territories were also receiving the highest location effects. We found that for Allstate, Auto Club, Citizens, and State Farm, each insurer’s most densely populated quintile had the most territories in the top fifth of location effects. However, Liberty Mutual’s distribution of location effects varied across density groupings.
Second, we compared the distribution of Black and White Michiganders in the location effect quintiles to their distribution in population density quintiles. This was to test whether the distribution across location effect quintiles roughly matched the distribution across population density quintiles.
If the population density of an area were as central to pricing as insurers’ responses claimed it to be, then we would expect similar percentages of a demographic group living within the highest-density territories as we would for those living in the territories with the highest location effects.
And yet we found a racial gap in location effects within the highest population density quintile across all insurers, with Black residents disproportionately receiving the highest location effects within the highest-density areas. For example, in Auto Club’s most densely populated territories, there were almost twice the number of Black residents experiencing the highest location effects than White residents, despite the fact that White residents outnumbered Black residents by almost two to one. On average, the percentage of Black people in each insurer’s densest territories receiving the highest location effects was 38 points higher than that of White people.
Other Circumvented Prohibitions
While our analysis centered on insurers using location-based factors, we also identified when they took advantage of other loopholes in the law to continue setting rates based on protected characteristics that the law appeared to prohibit.
These circumventions took several forms:
- The reform law applies to motor vehicle insurance but explicitly doesn’t include motorcycles under the definition of “motor vehicles.” This allowed insurers to continue to use factors like sex, marital status, and zip code in setting premiums for motorcycle insurance while not doing the same for their auto insurance lines.
- Insurance companies still used “insurance scores”; these include similar information as credit scores, which are prohibited. Credit score data is often sold by the same companies. A review of older filings showed that, prior to the reform, none of the insurers we examined were using credit scores to set rates—just insurance scores.
- The law distinguishes between rating factors (which can shift a premium up or down when applied to the base rate) and discounts (which can only shift premiums down). The prohibitions only apply to rating factors. Some insurers issue “good student discounts,” which only apply to full-time students under 24 or 25 who have high GPAs. This is allowed under the law.
See Appendix: Table B. Other Circumvented Factors.
Limitations
Statistical Tests
In addition to the quintile distribution analysis, we tried out several statistical techniques to analyze the relationship between the location effect and variables such as race, population density, and median household income. These techniques included the Pearson correlation coefficient, relative risk ratio, and regression analysis.
The Pearson correlation coefficient can be a misleading measure if the data has outliers. On average, 6 percent of location effects were outliers, mostly concentrated in Detroit. Instead of Pearson correlation, we calculated Spearman’s rank correlation coefficient. Spearman’s is a nonparametric statistical tool measuring the correlation between the rankings of data points. It is less sensitive to outliers than Pearson.
Relative risk ratio is commonly used to analyze the results of randomized controlled trials and is an inappropriate tool for our dataset.
A regression analysis, such as one looking at the relationship between race and location effect while controlling for population density, could be used to adjust for different factors such as race, income, and density to better determine causal relationships. However, an assumption required to run a regression analysis is that data points are independent. For this dataset, it would require that the location effect is set independently for each territory. Two statisticians cautioned us against making this assumption.
For at least one of the insurers in our analysis, we have reasonable evidence that the values at each location are directly influenced by all those around it. A 2014 State Farm patent detailing how to set values within a “grid-based rating insurance products” by combining risk information about each block in a grid with risk information from all of the blocks adjacent to it. State Farm did not respond to our question asking if this patent served as the basis for its rating system in Michigan.
Examination of Loss Experience
Insurance companies are supposed to make decisions about the base rates and relativities applied at each location based on how much money they have historically paid out in claims to policyholders in that area. Under conventional insurance practices, people who live in areas with lots of expensive traffic collisions would be charged higher prices than those who live in areas that have historically been less costly for insurers.
Since our specific research question was aimed at determining if Michigan’s insurance reform law made the state’s auto insurance market more equitable along racial and socioeconomic lines, looking at the relationship between a company’s loss experience in an area (how much customers there have previously cost to insure) and the premiums they charge was outside the scope of our disparate impact analysis.
In Michigan, DIFS regulators review insurers’ rate submissions and can object if they feel the rates being charged aren’t actuarially justified. All of the rate filings we examined for this investigation were approved by Michigan regulators.
A 2017 investigation from ProPublica asserted that drivers in less White areas across the country tend to pay considerably more than those living in more White neighborhoods, even when insurers’ loss experience is taken into account. A report by the Department of Insurance, Securities and Banking in Washington, D.C., found that, between the beginning of 2019 and the end of 2021, D.C.’s Black policyholders paid more for auto insurance than White policyholders and also cost insurers more money in terms of direct payouts. Washington, D.C., does not permit territory-based rating.
Location Rates vs. Final Premiums
A policyholder’s premium is typically based on dozens of different rating factors representing everything from the make and model of the insured vehicle to the age of the driver. Essentially, insurers use many different characteristics to predict how likely a driver is to file claims in the future. Customers who an insurer predicts are likely to file claims when their cars are broken into or after costly crashes are charged more than people considered safe drivers with low risks of filing claims.
Our analysis aims to isolate the effect location had on premiums, absent all other factors. We calculated location effects by multiplying all of the factors directly based on location by the base rates for each available type of insurance. We deliberately ignored all other factors not based on location. (See Calculating Location Effect.)
While these location effects show how geography influences premiums, they are not representative of the ultimate dollar cost that policyholders will be paying. The other rating factors used in premium calculations could dramatically shift what someone pays up or down. Someone with a lot of traffic violations on their driving record in a location where insurance tends to be relatively cheap could end up paying a higher final premium than a safe, responsible driver in an area where it’s typically more expensive.
Our analysis is not intended to provide direct insight into accurate dollar figures for what policyholders will be paying. Instead, we looked at just a slice of that calculation across all available insurance types. Our focus is on the differences of an insurer’s location effects within its territories and not the differences in the premiums the same driver would pay in a different area.
The absolute values of location effects from one insurance company cannot be compared to their competitors, since each insurer’s rating plan has a different mix of rating factors pushing premiums in either direction.
Use of Historical Data
Our analysis is based on documents insurers filed with DIFS between May 27, 2022, and Aug. 3, 2023. (See Data Extraction for the submission dates of each rate filing.)
Insurance companies regularly submit documents to state regulators detailing updates to their pricing models. In the time since each of these filings were submitted and approved, each of the insurers under analysis have submitted subsequent documentation altering their premium calculation formulas in some way. We did not examine these more recent filings. Therefore, our analysis should be viewed as a look into a particular moment in time.
Responses
Laura Hall, communications director in June 2024 for the Michigan Department of Insurance and Financial Services, wrote in an email that the agency cannot comment on the rate filings of any individual company.
However, in a statement, DIFS Director Anita Fox said that “under Michigan law and in states across the country, insurers must consider factors that impact losses and expenses, such as population density, frequency and severity of car crashes, and costs for claims, when establishing rates.”
Hall highlighted DIFS’s review process, noting the agency identifies, on average, nine problem areas with each filing that insurers are then required to address before an insurance product can be offered to Michigan residents.
“With regard to your study, it appears that the trend calculations and loss history were not part of the methodology. Excluding this data from your analysis would make it difficult to evaluate rates, as loss experience is the foundation upon which rates are developed,” Hall added. “That data is submitted as part of insurers’ filings, and it would be hard to complete a meaningful analysis of rate filings without including loss history and expenses.” (See Examination of Loss Experience.)
Representatives from Auto-Owners declined a request for comment.
In an email, Auto Club Group spokesperson Adrienne Woodland noted that the company has been serving the Detroit area for over a century and is “committed to providing fair and equitable rates for our members.
“The higher premiums in Detroit are a complex issue involving a variety of factors,” she wrote. “Urban areas have a greater population density along with congested roads and highways. Increased traffic and pedestrians on crowded roads lead to more crashes and therefore, more claims. The cost associated with these claims tend to be higher in urban areas due to increased litigation.
“We believe our pricing accurately reflects the various risks associated with insuring vehicles in different parts of the state,” Woodland continued. “However, we support ongoing efforts to address the underlying costs of providing coverage in Detroit, and the rest of the state.”
Liberty Mutual spokesperson Glenn Greenberg explained in an email: “We look at dozens of factors when determining a customer’s individual risk, any of which must be permitted by state insurance regulation. Certainly, the effect of these can vary greatly across territories given differences in such factors as traffic density, weather, vehicle repair costs and medical costs. Importantly, we do not utilize, collect or consider information related to an individual’s race in underwriting, premium determination or claims settlement practices.
“Our rates and discounts are filed with and approved as actuarially justified by the Michigan Department of Insurance and Financial Services,” he continued.
Emily Trevallion, a spokesperson for Hanover, Citizens’ parent company, asserted that our analysis was “fundamentally flawed” because “by focusing on the singular rating factor of location, it fails to consider actual loss costs and therefore cannot accurately reflect how insurance companies determine the price of insurance coverage.”
Trevallion asserted that state regulators review all of the company’s pricing systems in Michigan to ensure “rates are not excessive, inadequate or unfairly discriminatory, both by law and according to actuarial standards.”
She pointed to differing rates of traffic density, number of uninsured motorists, injury claims, variance in auto body repair costs, and incidence of fraud as reasons some areas may have higher prices than others.
Trevallion wrote that the company sets prices based on an interaction of different factors. “For example, Citizens uses annual mileage as a rating variable. It should not be a surprise that annual mileage varies substantially across the state with urban customers having lower annual mileage on average,” she noted. “Without contemplating that, and many other rating differences, the report’s illustration of our rates wildly exaggerates the actual differences paid by our customers in these geographies.”
Allstate communications manager Ben Corey wrote in an email: “This report is not accurate because it omits important factors for determining rates, including accident frequency and severity by area and the costs to cover customer claims. Our rates reflect the cost of providing the protection our customers depend on and all rating plans are approved by the Michigan Department of Insurance.”
Progressive spokesperson Ronald Davis wrote in a statement, “We work to price each policy accurately and fairly in accordance with Michigan laws and regulations.”
Representatives from State Farm did not respond to multiple requests for comment.
Representatives from Progressive and Citizens directed us to Nicole Mahrt-Ganley, a vice president at industry group American Property Casualty Insurance Association. In an email, Mahrt-Ganley asserted that “unfair discrimination in insurance rating—meaning treating consumers with similar risk profiles differently—is uniformly prohibited by state law. There is a substantial amount of academic research indicating that insurers’ use of rating factors does not result in unfair discrimination.”
Mahrt-Ganley pointed to a 2023 report by University of South Carolina professor Robert Hartwig that rejects “the hypothesis that insurance pricing is unfairly discriminatory as it relates to racial/ethnic minorities.”
Hartwig’s report draws a distinction between characterizations that insurance rates are discriminatory, which, in an insurance context, is when an insurer “treats persons with similar risk profiles differently,” as opposed to the sort of disparate impact analysis we conducted, which is focused on the difference in customers’ costs. A footnote of the report explains, “It is not within the scope of this paper to expound on disparate impact analysis.”
Conclusion
Our disparate impact analysis of how location affected insurance rates in Michigan found that five large insurance companies divided up the state so the Black population disproportionately lived in the most expensive areas to buy car insurance. Averaging across those five insurers, nearly two-thirds of Black Michigan residents lived in each insurer’s most expensive 20 percent of the state.
Auto Club and Citizens showed the strongest relationships between race and location effect.
In every case, the single most expensive part of the state was either inside of, or encompassed, the city of Detroit. We found that areas with more Black residents still tended to have higher location effects even when Detroit was removed from the analysis.
Turning to the relationship between rates and income, we found that, for the three insurers we were able to analyze, only one tended to assign higher location rates to lower-income areas.
Our investigation was spurred by a 2019 law instituting dramatic reforms for how auto insurance operated in Michigan. We had enough data to compare the pricing systems of two insurers before and after the law went into effect. In both cases, the percentage of the state’s Black residents living in the most expensive locations increased by two percentage points after the reform.
Our analysis is intended to shine a light on the inequalities in Michigan’s auto insurance system as it currently exists. All of these pricing structures were approved as being in compliance with state insurance rules by regulators at Michigan’s DIFS.
Acknowledgements
We thank Douglas Heller (Consumer Federation of America), Michael Lavine (University of Massachusetts Amherst), Daniel Schwarcz (University of Minnesota), and Amanda Nothaft (University of Michigan) for reviewing an early draft of this methodology.
We would also like to thank Isaac Remboldt for guidance and technical help.