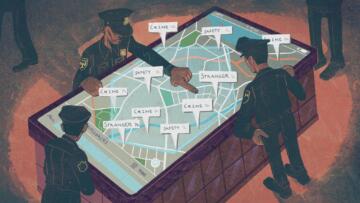
Introduction
Across the country, more than 2,600 police and close to 600 fire departments have partnerships with Ring, the popular doorbell camera company that was acquired by Amazon in 2018.
In 2018 and 2019, Motherboard, the Intercept, and other news organizations first documented the existence of Ring courting law enforcement agencies across the country, but five years later, little was known about how police work with Ring.
The Markup sought to get a better understanding of what kind of information is sent to police from Ring’s companion app and hyperlocal social platform Neighbors, the social platform that Ring camera customers and other people who register use to upload footage and post about their neighborhood.
This article describes our analyses’ data sources, methodologies, findings, and limitations.
We chose not to publish the data provided to us by the Los Angeles Police Department (LAPD) or Dan Calacci, to protect the privacy of individuals with identifiable information in the dataset. Journalists and academic researchers who want to use the data for non-commercial purposes can email us at hello@themarkup.org to request the data, and we will evaluate each request on a case-by-case basis. Please share details about who you are, and how you plan to use the data in your email.
Data Sourcing and Preparation
We used two main datasets to get a better understanding of the Neighbors platform, and a number of complementary datasets to further bring context to our analyses.
1. Neighbors email alerts received by the LAPD
The LAPD provided The Markup with 202,552 emails that were received by LAPD law enforcement officials from a Neighbors Public Safety Service email address (no-reply@neighborhoods.ring.com), in response to a public records request. The emails were provided in a .pst file type, a folder format native to Microsoft Office. The Markup requested all emails, regardless of time frame, received by LAPD from Neighbors. The dataset LAPD sent includes emails received between July 11, 2020, and September 30, 2022.
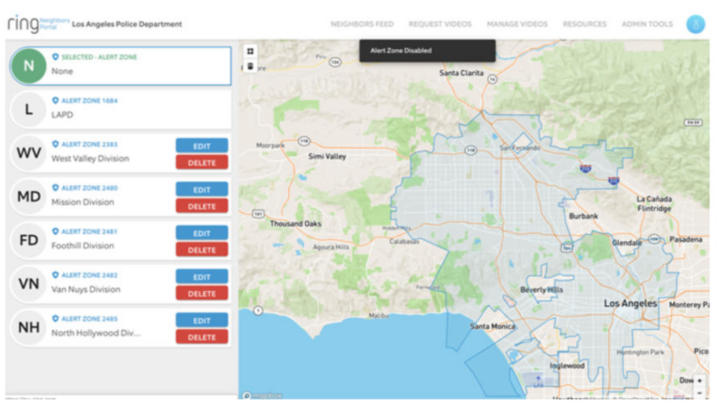
The email dataset showed that police officers, detectives, and sergeants whose departments partner with Neighbors can access special Neighbors portals. The LAPD’s portal is segmented into “alert zones,” or geographic divisions of the city from which the portal will send alerts to police personnel. According to emails between Ring’s partner success managers and LAPD officials, Ring created these alert zones using information, including Excel sheets of zip codes, provided by the police department.
On the Neighbors Public Safety Service website, any member of a U.S. “local public safety agency” is invited to email Ring directly or fill out a submission form for Ring to review. Once an agency joins the program, the Neighbors app provides “a tool to help [public safety agencies] better engage with and inform the communities they serve.” Through a public records request from NBC, The Markup obtained a screenshot of what the LAPD’s tool looks like.
In addition to being able to monitor crime via this portal, law enforcement officials can also opt into receiving automated alerts from the service via email:
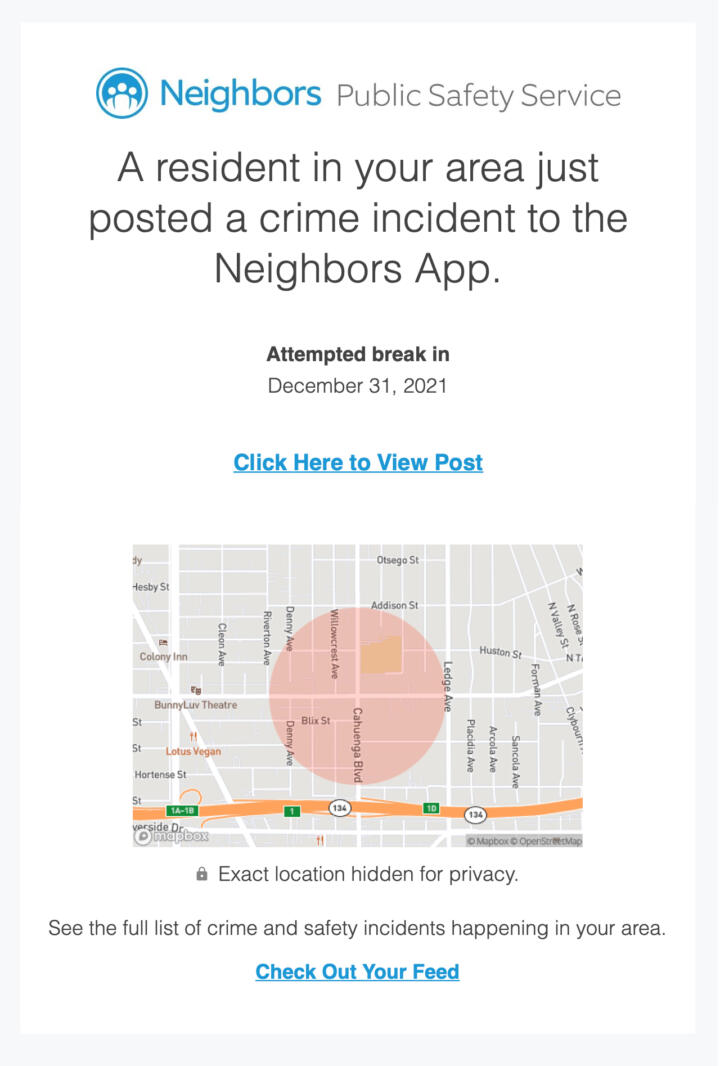
The vast majority of Ring email alerts to the LAPD that The Markup reviewed were alerts about crime and safety, and followed variations of this template. No information identifying individual users were sent through email unless the user put their information into the title or description of the forwarded post. In a small number of posts, residents shared their telephone number or the license plate of a car they saw. All email alerts included the date, title, and description of the Neighbors post.
In addition to alerts, the folders provided by LAPD also included other automated emails such as reminders for users of the service to log back in, or safety tips that Neighbors encouraged police officials to share on the platform. For example, 298 emails from Ring had the subject “New Shareable Graphics For Your Community.” Fifty-eight emails had the subject line “ACTION NEEDED: Your Account Will Be Deactivated.”
2. Neighbors posts
Dan Calacci, a postdoctoral fellow at Princeton’s Center for Information Technology Policy, shared with The Markup a dataset of more than 870,000 Neighbors posts he scraped from the Neighbors platform API. The data represents posts that residents published across the country between November 28, 2016, and February 15, 2020 by more than 650,000 unique users in the U.S. Calacci told The Markup that he collected the data by scraping posts from the API in March 2020. He laid out his methodology in greater detail in the research paper he co-authored with scholars Jeffrey J. Shen and Alex Pentland, “The Cop In Your Neighbor’s Doorbell: Amazon Ring And The Spread of Participatory Mass Surveillance.”
Each row in the dataset represents an individual post published on Neighbors. The dataset includes the following columns:
type: Type of alert. Possible values aretext_alert,image_alert,video_alert, orring_alert. The posts labeledring_alertare app-specific. Video, image, and text alerts usually correspond to user-posted content-
id: A unique ID assigned to the post title: The title of the postdescription: Narrative description provided by the usercategory: App-defined category for the postcreated_at: Timestamp when the post was createdlat: Approximate latitude of the postlng: Approximate longitude of the post
3. Additional datasets
In addition to the two main datasets, we also used:
- Census Bureau data: Tract-level data, and tract shapefiles, which detail the geographic boundaries and Census tracts for all 50 U.S. states.
- Data from censusreporter.org: We used Census Reporter to obtain a list of Census tracts that intersect with the official Census boundaries of the cities we wanted to analyze.
- Los Angeles city crime data from 2010 to 2019: We downloaded the data on August 14, 2023.
- Electronic Frontier Foundation’s (EFF) Atlas of Surveillance: This database from the EFF contains information about technologies used by police departments across the U.S., including which police departments have partnerships with Ring.
Using data from the Electronic Frontier Foundation’s Atlas of Surveillance and a gentrification analysis first developed by Columbia University, refined by Governing magazine, and then templatized while I, Lam Thuy Vo, was working at BuzzFeed News, we identified police departments that have partnerships with Ring and Neighbors, and also a high number of Census tracts that gentrified between 2000 and 2019. We chose this time frame because, at the time of analysis, the best historically harmonized Census data and tract boundaries were only available up until 2019. For this reason, we did not use American Community Survey (ACS) data from 2020 or later. You can find the gentrification analysis in this GitHub repository.
The Markup and a team of five students from the Craig Newmark Graduate School of Journalism at CUNY started with the 50 most populous cities. We analyzed how many of each city’s Census tracts had gentrified, and identified cities where police had partnerships with Ring. We then issued public records requests to the 25 cities that had partnerships with Ring and the highest rates of gentrification. (The New York City Police Department [NYPD] started a partnership after the project began. Since the NYPD is one of the biggest police departments in the country, The Markup filed an additional Freedom of Information Law request to receive data, but did not include the city in the analysis).
The team submitted public records requests to each city’s police department, asking for all alerts Neighbors sent to department employees. (For a deeper breakdown of our process, including a public records request template, stay tuned for a piece publishing in the near future.)
Even though only seven departments initially provided data in response to our requests, the LAPD gave us the most comprehensive dataset, and provided the data in the format we requested. This led us to focus our analysis on Los Angeles (The NYPD released records in September of 2023).
The LAPD provided a total of 202,552 emails inside several .pst files, each between 52.8MB and 8GB in size (32.89GB total). These files are native to Microsoft Outlook and generally represent folders of emails. To extract data from the email folder files, The Markup used a software called PST Bridge to view and convert the files to .mbox mailbox files, so that we could use more readily available and up-to-date Python libraries to extract the data.
Using a Python script, we extracted the meta data (including whom the emails were sent to, on what date and the subject line) as well as the body of the email.
The table below details what type of emails were part of the folders provided by LAPD:
The Markup reviewed each unique subject line, classified them, and created a crosswalk so we could easily separate Neighbors alerts from other types of emails. While the vast majority of emails had the subject lines “A Resident Posted a Crime Incident” (72,836 emails) or “New Crime Incident” (61,966 emails), there were some that had variable formats that included the title of a forwarded post, such as “Crime Alert: Stolen Trailer” or “New Crime Post: Graffiti.” We wrote custom scrapers for each format.
Excluded data entries
While the vast majority of entries in Calacci’s database were unique, seven of the 873,592 posts were duplicates, which we identified by grouping all post IDs. The only difference between duplicate entries was the share_url_v2 column value. Since this column did not factor into the analysis and to avoid double counting posts, we deleted the seven duplicates and kept the first entry listed in each duplicate pair.
Calacci removed official police departments from the database he shared with The Markup, but one account in the database posted in anomalous ways. This account posted 565 times, often writing about police activity in great detail. For example, posts from this user included titles like ”Car Theft Warning from DuPage Co. Sheriff’s Office” or descriptions like “Police officers responded to the area of Hawthorne Lane and Rosewood Drive in West Chicago on the city’s northeast side at 12:58 p.m. on January 24th for a report of shots fired and that a vehicle possibly involved had driven away. Three people were wounded.” While it’s unclear whether this account was a government institution or news agency, The Markup excluded this account from analysis because the formal writing and the abundance of posts suggested it was not a typical individual user.
In the Census ACS data, the value -666666666 means that “the estimate could not be computed because there were an insufficient number of sample observations.” To avoid this stand-in value from impacting analyses, The Markup decided to replace these values with null values. Additionally, we excluded tracts where the population was 0, and did not use tracts for income-related analysis if the median income was not available.
Analyses
We set out to explore two different aspects of Neighbors crime alerts that were sent to police:
- The users of the Neighbors platform and the content they produced
- The police officers, detectives, and sergeants who received the email alerts
Distribution of Neighbors alerts by topic
According to emails from Neighbors to police from a separate records request filed by NBC, only posts that are classified as “crime” are forwarded to police officers, though the emails also included a significant number of safety alerts. After speaking with several policing, privacy, and surveillance technology experts (See Acknowledgements) who wanted to know if the claim was true, The Markup set out to test this claim.
On the Neighbors platform, users self-select categories for their posts, but it’s unclear if users have a common understanding of what constitutes a crime.
Each crime alert was sent to at least one and up to 60 law enforcement officials, amounting to a total of 191,554 crime alert emails received by the LAPD. To analyze the emails’ content, we first identified unique alerts by grouping the data by the calendar date, the post title, and the post description.
Out of the 191,554 alerts, The Markup found that 13,053 were unique crime alerts. To understand the content of these alerts, The Markup extracted a random sample of 1,000 alerts, reviewed each alert three times, and categorized the alerts.
First, The Markup categorized the alerts based on whether posts included criminal acts in the title or description. We defined “criminal act” based on the California criminal codes.
Despite Neighbors’ claim that only posts classified as crimes are forwarded to police officers, The Markup found that over 30 percent of posts did not describe criminal activity.
Second, The Markup categorized the alerts based on subject area, specifically focusing on the type of behavior or crime reported. Theft was the most common subject area, representing 38 percent of posts. The second most common area was user posts reporting suspicious behavior, which represented 16 percent of posts. Alerts that were clearly not definable as criminal activity also included posts about confusing events in the neighborhood (12 percent of posts) and a lost person or pet (2 percent of posts).
Median income and crime analysis
In addition to using the LAPD’s email alert data to analyze whether the alerts themselves were exclusively reports of criminal activity like Neighbors claimed, The Markup used Dan Calacci’s dataset of 870,000 Neighbors posts to analyze two broader relationships:
- The median income of a neighborhood, compared to the number of Neighbors posts (per 1,000 residents), across all posts
- Median income of a neighborhood, compared to the crime rate (per 1,000 residents) in Los Angeles
We switched to Calacci’s dataset for this analysis, because it covers a broader amount of time (four years instead of one), and because the dataset contains all Neighbors posts created during this time period—not only what was forwarded to LAPD. Calacci’s dataset also includes the latitude and longitude of each post, which allowed us to merge his dataset with Census tract-level data.
Merging Census data
For both analyses, we used tract-level data from the Census Bureau’s American Community Survey five-year population estimates from 2014 to 2019. Since Calacci’s dataset does not capture the pandemic and 2020 Census data saw a lot of anomalies—from difficulties reaching households to getting accurate counts due to social distancing to issues with mass migration within the U.S. due to the pandemic—The Markup used the 2019 count for this analysis.
Using a spatial join, we matched the latitude and longitude of individual posts in the dataset with the geographic shapefiles of the 25 cities the Markup requested public records from, as well as tract-level Census and Los Angeles crime data.
Income in 25 cities
To understand how the rates of Neighbors posts differed based on income, The Markup divided each city into 10 income percentiles: tracts with median income level below the 10th percentile, within the 10th percentile to the 19th percentile, the 20th to the 29th percentile, and so on.
For each percentile, we totaled the number of Neighbors posts in 2019, and the total population count. We chose to examine data for one year to minimize the impact of users potentially moving away.
This analysis showed that in general, the rate of posting and the total number of posts in poorer neighborhoods were lower than the rates in middle-class or richer neighborhoods. But trends across the nation vary.
Four of the cities we examined showed a statistically significant positive correlation between income and number of posts, meaning there were more posts per 1,000 residents in richer neighborhoods than there were in poorer neighborhoods. This trend was particularly pronounced in cities like Los Angeles, Phoenix, Ariz., Fresno, Calif., and Houston, Texas. In 13 cities, there was no statistically significant relationship between income and posting rates. In five cities, the trend was reversed.
We ran several tests, including a regression and a Pearson test, for our analysis that compares the posting rates to median income. For a finding to be statistically significant, the p-value had to be under 0.002—0.05 divided by the number of tests we did.
Income and crime in Los Angeles
In Los Angeles, we followed the above income analysis, and looked at the number of crimes reported in the 10 income percentiles within the city.
The rate of posts per 1,000 residents in richer neighborhoods was 3.5 posts per 1,000 residents, and only 0.5 in lowest income neighborhoods.
For our crime analysis, we looked at two of the most prevalent crimes reported in the data, “burglary from vehicle” and “battery – simple assault.” The former is helpful information for context: A sizable number of Neighbors posts reviewed by The Markup included car break-ins. The latter, simple battery assaults include striking, punching, or otherwise physically harming someone, and represents the kind of violent crime that is often top of mind for many people, especially in election cycles, according to the Pew Research Center.

Our analysis found that poorer neighborhoods reported a crime coded as “battery – simple assault” at a rate of 8.7 crimes per 1,000 people, while the richest neighborhoods reported rates of battery and simple assault at 2.4 crimes per 1,000 people. Our analysis did not find any significant correlation between income and burglaries from vehicles reported.
In other words, The Markup found that in Los Angeles, richer neighborhoods posted the most often on Neighbors, while poorer neighborhoods posted the least often on Neighbors. But rich neighborhoods did not report higher simple assault battery crime rates. Meanwhile, car break-ins were reported at similar rates across all deciles in the city.
Limitations
There are several limitations to the datasets used in this analysis.
First, the LAPD dataset may underrepresent the number of police officers who have at one point used the Neighbors platform. That is partly because not every user may have opted into receiving email alerts. The Markup does not know whether law enforcement officials have access to deleted emails. LAPD Officer Drake Madison did not answer specific questions about the data and instead said that the LAPD did “not work specifically with RING.”
Since The Markup does not know how the LAPD searched for these emails, and whether their exports are comprehensive, the total email count should be treated as a minimum.
It is also important to note that Calacci’s database is from a different time frame than the LAPD’s, thus depicting different iterations of the app and users on the app. This is why The Markup reports on our findings from each dataset separately.
Geographic coordinates associated with alerts in Calacci’s data (likely coming directly from the Neighbors API) are likely for a nearby intersection, and not a user’s exact location, according to Calacci. The company says that they do not display a user’s exact location when posting on Neighbors, which is likely why the location is often to the nearest intersection. This has caused a number of duplicate entries for some posts, because a small number of Neighbors posts border on multiple Census tracts. The duplicates increased the number of posts by about 2.3 percent, by adding 2,950 duplicate rows to the total. To avoid counting a post multiple times, we decided to attribute posts that were bordering multiple tracts to the most populous tract.
When neighboring tracts had the same population count, we attributed the post to the Census tract with the GEOID, a unique identification code assigned to each Census tract, that placed it higher on an alphabetical order. There were two posts with geolocations that were bordering two census tracts with the same population. Those were posted in Indianapolis on the border of Census tract 3103.05 and in Census tract 3103.06. In both cases, The Markup attributed the duplicate entry to Census tract 3103.05.
Organization Responses
Despite Ring calling these programs with police departments “partnerships,” the LAPD’s spokesperson doesn’t see them that way.
“We do not ‘work with’ RING,” wrote Officer Drake Madison in an email to The Markup. “We do not know of a ‘subscription’ to the RING Neighbor Portal,” he wrote in another email.
Ring did not respond to specific questions about Neighbors and did not comment on the data analysis methodology shared with them in advance of publication. Instead, spokesperson Mai Nguyen shared a general overview of Ring’s work with the police: “Neighbors is a free app designed to help communities connect and stay informed about what’s going on around them—whether users own a Ring device or not. We’ve seen many positive examples of communities working with public safety agencies to raise awareness about safety, return missing people to their families, and bring lost pets home. All posts and comments on Neighbors are publicly viewable on the Neighbors feed by users and public safety agencies alike. Both users and public safety agencies control whether and what type of posts they receive via email alerts.”
Conclusion
The Markup sought to get a better understanding of the information shared between Neighbors and police officers. Overall, our analysis helped establish a few main conclusions.
Our analysis of a random sample of Neighbors notifications found that one-third of the alerts sent to the LAPD did not describe criminal behavior.
We also found that residents in neighborhoods that are wealthier post more often on Neighbors, with strong statistically significant correlations in four cities: Los Angeles; Phoenix, Ariz.; Fresno, Calif.; and Houston.
In Los Angeles, where The Markup focused our reporting, we found that richer neighborhoods posted the most often on Neighbors, while poorer neighborhoods posted the least—despite the fact that richer LA neighborhoods did not report higher crime rates.
Acknowledgements
This series was made possible through support from the Pulitzer Center’s AI Accountability Network.
Randi Love, James O’Donnell, Ariana Perez-Castells, Natalia Sánchez Loayza, and Paisley Trent contributed reporting to this story. They were students at the Craig Newmark Graduate School of Journalism at CUNY at the time and helped conduct the public records audit.
We thank Jennifer Nelson of the Reporters Committee for Freedom of the Press for helping us navigate legal issues around the public records audit, and Claire Wardle of Brown University for advising on how to best classify unstructured data on various social media platforms.
Interviews with Albert Fox Cahn, founder and executive director of the Surveillance Technology Oversight Project; Hamid Khan, an organizer with Stop LAPD Spying Coalition; Ángel Díaz, a visiting assistant professor at the University of Southern California (USC) Gould School of Law; and Ben Stickle, porch piracy expert and associate professor of criminal justice administration at Middle Tennessee State University, helped developed the analysis of the LAPD email alerts and the Calacci database.