Investigations and Tools

  • Amazon’s Advantage
  • Organ Failure
  • Blacklight
  • Pixel Hunt
  • Citizen Browser
  • Privacy
  • Languages of Misinformation
  • Still Loading
  • Machine Learning
  • Working for an Algorithm
  • About Us
  • Donate
  • Awards
  • Have a Tip?
  • Team
  • Show Your Work
  • Jobs
  • Newsletters
  • Events
  • Facebook
  • Twitter
  • Instagram
  • Mastodon
  • RSS Feed
  • Bluesky
Skip navigation
Menu The Markup Donate
  • About Us
  • Donate

See the Neighborhoods Internet Providers Excluded from Fast Internet

By Joel Eastwood, Leon Yin, and Aaron Sankin
May 11, 2023 09:00 ET
Viewable online at
https://themarkup.org/still-loading/2023/05/11/see-the-neighborhoods-internet-providers-excluded-from-fast-internet
↩︎ link
Still Loading

See the Neighborhoods Internet Providers Excluded from Fast Internet

Explore The Markup’s interactive map to see where AT&T, CenturyLink, and Verizon offered only slow internet speeds in major U.S. cities

By Joel Eastwood, Leon Yin and Aaron Sankin May 11, 2023 09:00 ET

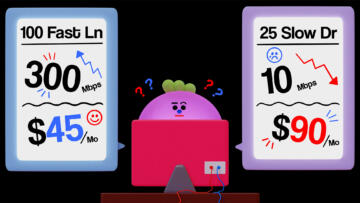
Address by address, this map shows the drastically different internet speeds offered by AT&T, CenturyLink, or Verizon—all at the same price point per provider—in major U.S. cities.

A Markup analysis revealed that the worst internet deals disproportionately fell upon the poorest, most racial and ethnically diverse, and historically redlined neighborhoods in all but two of the 38 cities in our investigation.

  • Test for disparities in your area
  • Read our award-winning investigation

How did The Markup collect the data?

Between April and October 2022, The Markup collected more than one million internet plans from 45 major cities across the United States from four of the nation’s largest internet service providers’ websites. We investigated AT&T, CenturyLink, EarthLink, and Verizon because they each practice “tier flattening,” a pricing strategy that charges the same rate for drastically different internet speeds, depending on where you live.

Spokespeople from these ISPs denied deliberately giving worse deals to households in marginalized areas but did not reject our findings that they widely engaged in tier flattening.

We did not test all 45 cities for disparities because some cities had no variations in speeds and others were not the largest city in the state. For each city, we collected a 10 percent random sample of addresses, as shown on the map below.

  • Learn how The Markup collected, categorized, and analyzed the data

How can I use this map?

Navigate through the 45 cities in our dataset by selecting a city from the dropdown or dragging the map to pan across the country. Select a dot on the map to see the details of that address, including upload and download speeds, which ISP made the internet offer, and the demographics of the neighborhood.

Addresses can be filtered by demographics, including median household income, share of White residents and, in certain cities, historical redlining grade.

This data was used by nine local news outlets to produce original reporting, and we have published a build-your-own dataset guide so that anyone can start gathering internet plans in their area, with no special skills required.

We used two open-source address datasets for geocoding, and they’re imperfect. If you spot an address you think is in the wrong place, email us at byod@themarkup.org.
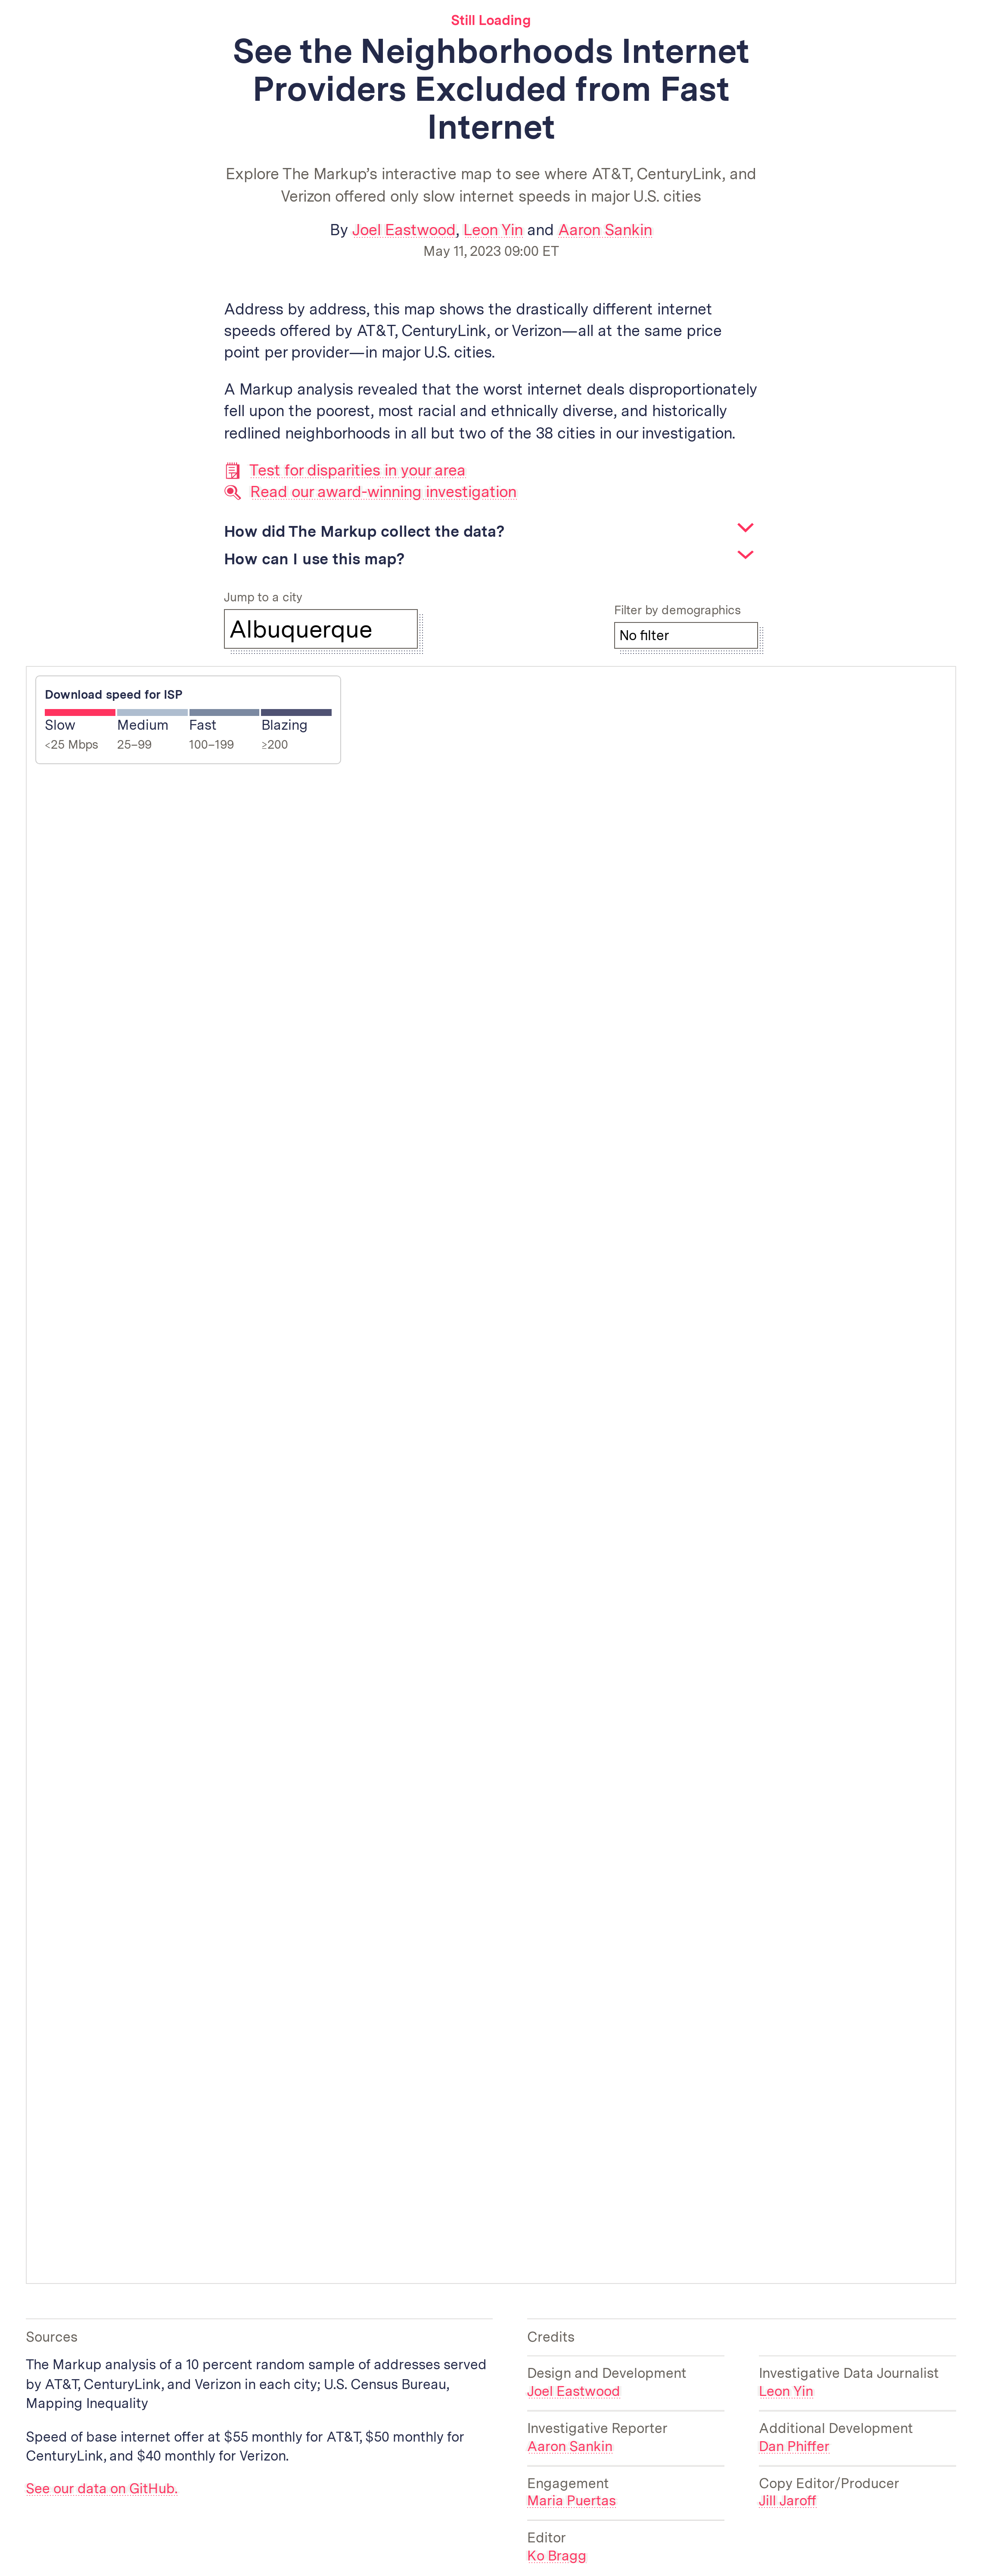
Slow
<25 Mbps
Medium
25–99
Fast
100–199
Blazing
≥200

Sources

The Markup analysis of a 10 percent random sample of addresses served by AT&T, CenturyLink, and Verizon in each city; U.S. Census Bureau, Mapping Inequality

Speed of base internet offer at $55 monthly for AT&T, $50 monthly for CenturyLink, and $40 monthly for Verizon.

See our data on GitHub.

Credits

Design and Development

  • Joel Eastwood

Investigative Data Journalist

  • Leon Yin

Investigative Reporter

  • Aaron Sankin

Additional Development

  • Dan Phiffer

Engagement

  • Maria Puertas

Copy Editor/Producer

  • Jill Jaroff

Editor

  • Ko Bragg
Close
Republish

See the Neighborhoods Internet Providers Excluded from Fast Internet

We’re happy to make this story available to republish for free under the conditions of an Attribution–NonCommercial–No Derivatives Creative Commons license. Please adhere to the following:

  • Notify us: Please email us at republish@themarkup.org to let us know if you’ve republished the story.
  • Give prominent credit to The Markup and its journalists: Credit our authors at the top of the article and any other byline areas of your publication.
  • Do not edit the article: The complete, unaltered article text must be published. If you wish to translate the article, please contact us for approval.
  • Access to the article must remain free: Do not sell access to this article or place it behind a paywall, but you can republish our articles on sites with ads.
  • Images may not be available for republication: Not all of the imagery used in articles published on our site are licensed under Creative Commons. Some images are from commercial providers who do not allow their images to be republished without permission or payment. If you wish to use any image from our articles, email us at republish@themarkup.org for guidance.
  • Use the provided HTML to republish this article on your site: Simply copy the HTML that we have provided and publish it as is on your website. The provided HTML snippet includes all text formatting and hyperlinks, the author byline, and credit to The Markup. If the HTML code for The Markup credit image is incompatible with your CMS, let us know if you remove it.
Copy HTML

Related

Illustration of a character behind a computer with a puzzled look on their face. There are two bubbles to the left and right of them containing different internet plan information and numbers.

Build Your Own Dataset

Slow Internet? Find Out What Side of the Digital Divide You’re On

All you need to test for disparities in internet speeds and pricing is a computer, internet access, a Google account, and some free time

May 11, 2023 09:00 ET
An illustration of two houses, one receiving many dashed blue lines and the other receiving a single pink line, against an abstract street grid.

Still Loading

Dollars to Megabits, You May Be Paying 400 Times As Much As Your Neighbor for Internet Service

An investigation by The Markup found that AT&T, Verizon, EarthLink, and CenturyLink disproportionately offered lower-income and least-White neighborhoods slow internet service for the same price as speedy connections they offered in other parts of town

October 19, 2022 06:51 ET
An illustration of two houses, one receiving many dashed lines and the other receiving a single line, against an abstract street grid.

Show Your WorkStill Loading

How We Uncovered Disparities in Internet Deals

AT&T, Verizon, EarthLink, and CenturyLink disproportionately offered the worst deals to lower-income areas and communities of color across the country—while charging the same for faster speeds in higher-income and Whiter areas

October 19, 2022 06:51 ET
Return to The Markup's homepage

Your contributions help us investigate how technology influences our society.

Donate
  • About Us
  • Our Donors
  • Ethics Policy
  • Events
  • Board of Directors
  • Jobs
  • Team
  • Have a Tip?
  • Newsletters
  • A Letter from the President
  • Awards
  • Privacy Policy
  • Terms of Use
  • Facebook
  • Twitter
  • Instagram
  • Mastodon
  • RSS Feed
  • Bluesky