
In the first installment of our series Prediction: Bias, we investigated the use of Geolitica, a software that claims to take historical crime data and predict where and when future crime is most likely to occur. We found the software disproportionately directed officers to patrol neighborhoods with relatively higher percentages of low-income, Black, and Latino residents compared to those cities or counties on the whole. Our analysis was based on data produced by Geolitica and provided directly to police departments in 38 jurisdictions across the U.S. Geolitica was formerly known as PredPol until 2021.
To assess what impact the software had on policing, we also compared the predictions to arrests that occurred during the same time period for 11 departments that shared arrest data with us. We found that rates of arrest in predicted areas remained the same, regardless of whether Geolitica predicted a crime that day. In other words, we did not find a strong correlation between predictions and arrests.
At the time of our initial investigation, we could not definitively say how police acted on any individual prediction, because only one jurisdiction shared enough of the software’s “dosage” data, which indicates when an officer went to the location of a predicted crime and how long they stayed in the area. Another jurisdiction shared only two days’ worth of dosage data. The rest claimed that they either didn’t have the data or it wasn’t public information.
This information is necessary to properly investigate the software’s accuracy because Geolitica asserts that patrols in response to its predictions reduce the likelihood of crimes occuring there. If a police officer visits a prediction location and a crime doesn’t occur, it would be impossible for us to determine if the prediction itself was inaccurate, or if the officer’s presence at the location deterred someone from committing a crime in the first place. To analyze the accuracy of Geolitica’s software in predicting crimes, we needed to exclude all the prediction locations that were visited by a police officer.
See our data here
Only the city of Plainfield, New Jersey, provided us dosage data over a long enough time period to conduct our analysis. However, the dosage rate, indicating the frequency that an officer visited a Geolitica prediction box, was so low that we had assumed the dataset was somehow incomplete and therefore not suitable for analysis. At the very end of the reporting process for that story, we learned from Plainfield law enforcement officials that, while the agency had purchased and fed data into the system, it was rarely, if ever, used to direct patrols. Officials insisted that any time the data showed an officer visiting a prediction location, it was a coincidence—meaning the low dosage rate accurately reflected the reality on the ground rather than an error in the data.
This follow-up analysis uses the crime reports and dosage data received from the Plainfield Police Department (PD) to determine Geolitica’s accuracy in predicting crimes.
The Data
We used three datasets for this analysis:
- Prediction data from Geolitica that we found on an unsecured cloud storage bucket
- Crime reports provided by the Plainfield PD under a public records request
- Dosage data (the term for the records Geolitica keeps when an officer patrols a prediction location), including how much time officers spent there, also provided by the Plainfield PD
We requested and received crime reports from the city starting from the end of February 2018 to January 2019. This is the time period for which we had prediction data and the length of time the Plainfield PD told us they had an active contract with Geolitica. There was a significant drop-off in the number of crime reports at the end of December 2018, the reasons for which were unclear. To err on the side of caution, we chose to shorten the analysis period from Feb. 25, 2018, through Dec. 18, 2018, so the drop-off would not be a part of our analysis. We excluded reports in which addresses could not be clearly determined or which occurred outside of Plainfield. The total number of crime reports after exclusions was 3,066.
Seven categories accounted for more than 80 percent of all crime reports:
- Offenses not covered by other classes
- Various types of larceny
- Simple assault
- Criminal mischief
- Fraud
- Possession of marijuana
- Possession of opium, cocaine, or heroin
The department said that “offenses not covered by other classes” encapsulated a variety of crimes, including drinking in public, kidnapping, illegal dumping, and alerts from the gunshot detection system ShotSpotter. The reports did not indicate whether the incident was reported by a police officer on patrol or by the public.
During the same time period, Geolitica’s software made 23,760 predictions at around 360 different locations. Each prediction consisted of a bounding box approximately 500 feet by 500 feet, indicating an area where the software predicted certain crimes were likely to occur. A location marker roughly centered within each box is keyed with an address.
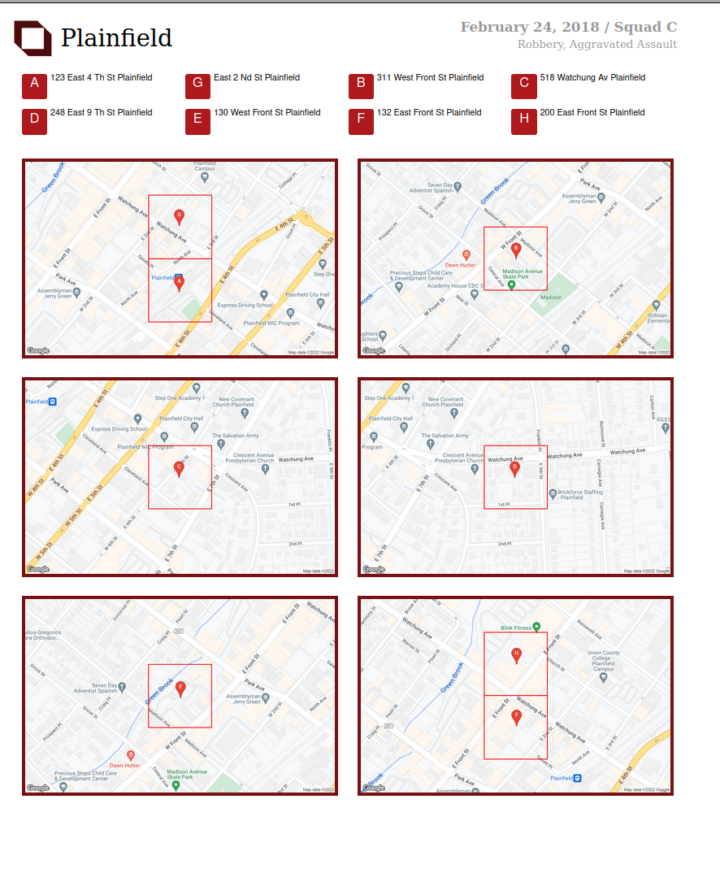
One page of a sample prediction report is above. Each page lists the date, squad identifier, incident type, and a list of crime prediction locations to patrol. The predictions are associated with a “squad” ranging from “A” to “D,” corresponding to police shifts throughout the day. These shifts are determined by the police departments, not Geolitica. The company generated 80 predictions per day, which all fell during one of these four shifts, with each shift lasting just shy of 12 hours.
The dosage data we received from the Plainfield PD contained 212 unique records during our analysis period. The average duration of those patrols was approximately 20 minutes. Plainfield PD said this dosage data is recorded by dispatchers as officers radio in their whereabouts.
Excluding all predictions that had accompanying dosage, we ended up using 23,631 predictions as the basis for our analysis.
Crime Types
Plainfield used the crime prediction software to predict various crime types, including motor vehicle theft, robbery, aggravated assault, non-residential burglary, burglary, and gun crime. The software always grouped residential and non-residential burglaries together, as well as robberies and aggravated assaults. This means the software only ever made four distinct types of predictions. The distribution of these is shown in the chart below.
From Feb. 25 to Dec. 18, 2018, reports of actual crimes in Plainfield included 336 instances of these types of crime. We made this determination by manually checking each crime report’s description against the types of crime Geolitica was predicting.
Analysis
To measure how well the software was able to predict crimes, we ran two analyses:
- How many of the predictions correctly anticipated crime reports
- How many reported crimes Geolitica was able to predict
Matching Predictions to Reported Crimes
For both of these analyses, we needed to identify the predictions that “matched” a reported crime—that is, situations in which a crime’s type, time, and place was predicted, and a crime matching across all three variables was later reported.
Geolitica claims its prediction boxes are 500 feet by 500 feet, but we found that markers were often not centered exactly in the boxes, and the box sizes were all slightly smaller than 500 feet by 500 feet.
Since the boxes provided in Geolitica’s reports varied in size and positioning relative to the markers, we used larger boxes (600 feet by 600 feet) for our analysis. While doing so theoretically could lead to an overcount of correct predictions, we took the most generous approach possible, allowing us to account for sizing discrepancies and some level of address imprecision in the crime reports.
We used a geospatial library called GeoPandas to determine if a crime report’s coordinates fell within a given 600-by-600-foot prediction box. If they did, we considered the location of the crime to have occurred at the location where Geolitica made a prediction. Then we checked the crime type. If the report crime type matched the type of crime Geolitica was predicting, we considered the prediction to be correct.
Measuring the Software’s Prediction Success Rate
We focused on the two categories that made up more than two-thirds of Geolitica’s predictions during our period of analysis: robberies and aggravated assaults, which Geolitica reported together as a single category, and burglaries.
A factor that could have influenced the software’s success rate was “dosage.” According to the company’s claims, “high-risk” areas with “dosage,” or officers showing up to locations where Geolitica forecasted an incident, should result in fewer crime reports. To account for this, we ran our analysis by filtering out the predictions that had a corresponding dosage. Put another way, we only looked at prediction boxes where no police patrol showed up.
Robberies and Aggravated Assaults
During the time period of our analysis, Plainfield PD’s data showed 139 crime reports listed as robbery or aggravated assault. Meanwhile, Geolitica generated a whopping 5,766 predictions for robbery or aggravated assault in Plainfield. Of those, 44 had corresponding “dosage,” resulting in 5,722 predictions without dosage. Despite the massive number of alerts, only 20 of the 139 reported robberies and aggravated assaults occurred at the same time and location as a prediction. Of the 5,722 predictions, 32 corresponded to those 20 unique incidents, as predictions sometimes overlapped in geography and timing, for a success rate of 0.6 percent—meaning that around 6 out of every 1,000 predictions successfully anticipated reported robberies or aggravated assaults.
Burglaries
Geolitica generated 10,141 predictions for burglaries between late February and mid-December 2018. During that same time period, 116 burglaries were reported and only 8 of 116 occurred when Geolitica said they would. That’s a success rate of 0.1 percent.
Alternative Analysis Including “Dosage”
While the company claims that high risk areas with “dosage”—meaning where police responded to the predictions—should result in fewer crime reports, it is possible that police presence actually leads to more crimes being reported, generating a feedback loop that gradually amps up police presence in a given area. To account for this, we also calculated the prediction success rate of the software, but this time we included the predictions that had a corresponding dosage.
Overall, there were not many instances of dosage in Plainfield. Department officials insisted in interviews that the software was never actively used to direct patrols and all instances of dosage corresponding with predictions were simply coincidences. Based on the dosage data from our public records request, we found that out of the 23,760 predictions generated by the software for our time period, actual police patrols took place in only 129 instances within the associated prediction bounding box during any point during the prediction’s timeframe. When we included predictions with a corresponding dosage and re-ran the analysis, we didn’t observe a significant change in our findings.
We did not measure the prediction success rate using only predictions with a corresponding dosage, because there weren’t enough observations for us to draw any conclusions. For robberies and aggravated assaults, there were 44 instances of predictions with dosage, and in none of those cases was a corresponding crime later reported. For burglaries, there were 37 instances of predictions with dosage, and, again, no corresponding crimes were reported.
How Many Reported Crimes Did Geolitica’s Software Predict?
A significant amount of research shows that reported crimes tend to aggregate in hot spots.
A significant amount of research shows that reported crimes tend to aggregate in hot spots. While the environmental factors contributing to each type of crime are unique, crimes of many different types tend to cluster in relatively concentrated geographic areas of any given city. According to this theory, areas that are more likely to have motor vehicle thefts could also have more crimes of other types, like robberies.
Looking at the data through this lens, we calculated how often Geolitica accurately predicted any kind of crime. To do this, we compared predictions of any of Geolitica’s top four categories to all crime reports in Plainfield. Even in this case, the number of predictions with any corresponding report was 18 percent. Filtering for the categories Geolitica predicted, we found that the software correctly predicted only 34 (10 percent) of Plainfield’s 336 reported motor vehicle theft, robbery, aggravated assault, burglary, and gun crimes.
Limitations
During the reporting process for our initial investigation into Geolitica’s crime prediction algorithm, the Center for Policing Equity’s Co-Founder Phillip Goff told us, “There is no such thing as crime data, there is only reported crime data. And the difference between the two is huge.”
Since our investigation relies on reported crime data, much like Geolitica’s prediction algorithm, our analysis has several limitations.
A 2019 report by the Bureau of Justice Statistics found that only 41 percent of violent crime victims reported what happened to the police.
For instance, when assessing the accuracy of Geolitica’s predictions, we were only able to compare them to crimes that were reported to the Plainfield PD. Crimes that occurred but were never reported could not be included in our analysis. A 2019 report by the Bureau of Justice Statistics found that only 41 percent of violent crime victims reported what happened to the police. White victims were also less likely than Black or Hispanic ones to report being victims of crimes to law enforcement.
Another crime reporting limitation comes in the way that Plainfield PD categorizes crimes. The department uses the FBI’s Hierarchy Rule, “which requires that only the most serious offense in a multiple-offense criminal incident be counted.” This rule means, for example, if someone broke into a house with the intention to steal a TV and then killed the occupant in the process, the crime report would record the offense as “murder” rather than “burglary.” Since we were not able to see the lower-ranked crimes in the crime report data we obtained from the Plainfield PD, there is the possibility that we may be missing some matches between predictions and those crime reports.
We also assumed the addresses listed on the crime report data were correct as recorded by the Plainfield PD, both in terms of general location accuracy (for instance, a crime occuring at 911 Plainfield Avenue actually occurring at 911 Plainfield Avenue) and in terms of specificity. Some crime reports listed an intersection as the address (for instance, Central Avenue and W. 4th Street). In those cases, we located the coordinates in the center of the intersection. It is possible, however, that the crime actually occurred a bit down one of the blocks and not in the very center of the intersection. Some other crime reports listed addresses with large, round numbers that did not exist in Plainfield (for instance, 100 E. 5th Street). In those cases, we interpreted the address to be referring to the “100th block of E. 5th Street” and located the point at the nearest intersection.
We frequently observed that Google’s geolocation API returned coordinates that were either obviously incorrect or were hundreds or thousands of feet away from those provided by other geocoding services, such as the Census Geocoder. Due to these issues with programmatic geolocation, we manually checked or geocoded hundreds of addresses for the crime reports for the main crime types we analyzed. To do so, we used building numbers displayed on Google Maps, as well as open-source investigation techniques, such as visually matching homes and businesses to photos on real estate listings or exterior marketing signage, or matching buildings using Google Maps and the Census Reporter tool, which is based on the Mapbox platform.
A 2015 study, which shared authors with some of Geolitica’s founding team, indicated that Geolitica’s mapping system used Google’s geocoding API. Therefore, we manually located the point inside of the building matching the address provided in the police report, rather than on the street in front of the building, since this is how Google’s programmatic systems tend to place location points.
Company Responses
We sent a draft version of this methodology, along with a list of questions, to Geolitica, but representatives from the company did not respond in any way to our inquiry, or multiple requests for comment.
Shortly before publication, Wired published an article detailing how Geolitica plans to cease operations at the end of 2023. The company’s engineering team has been hired by SoundThinking, which was previously known as ShotSpotter. SoundThinking is also in the process of acquiring some of Geolitica’s intellectual property and is migrating Geolitica’s subscribers onto a similar product of its own.
When asked about The Markup’s findings on the success rate of Geolitica’s predictions, SoundThinking Senior Vice President Sam Klepper wrote in an email, “SoundThinking was not interested in and did not purchase the source code for the modeling of the Geolitica prediction system, so it was not considered during the transaction.”
The Markup’s analysis suggests that Geolitica predicted crime at a rate slightly better than blindly throwing darts at a map.
Conclusion
The Markup’s analysis suggests that Geolitica predicted crime at a rate slightly better than blindly throwing darts at a map. But any officer policing a community would undoubtedly notice reported crime trends in their jurisdiction and patrol these areas more frequently.
Numerous studies have shown crimes tend to be largely reported in a relatively small number of blocks in a given city. One study in Seattle showed that 50 percent of reported crime incidents happened on just 4.5 percent of the city’s blocks over a 14-year period.
A 2019 thesis written by Ana Lalley, the chief of the police department in Elgin, Ill., which previously used Geolitica’s crime prediction software but has since discontinued use, highlights how Geolitica’s predictions didn’t tell the department anything its office didn’t already know. “Officers routinely question the prediction method,” Lalley wrote. “Many believe that the awareness of crime trends and patterns they have gained through training and experience help them make predictions on their own that are similar to the software’s predictions.”
Another way to evaluate the predictions: How often were crime reports preceded by a matching Geolitica prediction? In our dataset, 336 crime reports followed a Geolitica prediction that some type of crime would occur, but the company’s predictions only successfully matched the timeframe, location, and crime type of 34 crime reports—an accuracy rate of 10 percent.
However, the software’s stated function is to help law enforcement officials be proactive by visiting potential crime locations before the crime occurs. While that 10 percent success rate is interesting as an academic exercise, it appears to be less useful for evaluating the software.