About the LevelUp series: At The Markup, we’re committed to doing everything we can to protect our readers from digital harm, write about the processes we develop, and share our work. We’re constantly working on improving digital security, respecting reader privacy, creating ethical and responsible user experiences, and making sure our site and tools are accessible.
At The Markup, we make extensive use of custom interactive graphics to illustrate our stories. When I started my internship this summer, one thing I was curious about was the process for creating and integrating those graphics into the content management system (CMS). When I worked for Berkeleyside and even my high school newspaper, I struggled to find an elegant solution and discovered that this is a common and historical headache in the news industry.
The reality is that a CMS like WordPress intentionally limits customization. The job of a CMS is to provide a simple interface for storing and editing structured data. Custom graphics, however, are inherently ad hoc and unstructured.
To newsroom developers creating custom interactives for the first time, it can be hard knowing how and where to incorporate them into the CMS. Choose the wrong process or place, and you’re left with an unruly mess.
Let’s Get Philosophical
One facet of software engineering, as in life, is the need to make trade-offs in the face of constrained resources. Finding that balance between flexibility and standardization is the essence of designing software, and integrating graphics into a CMS is no different.
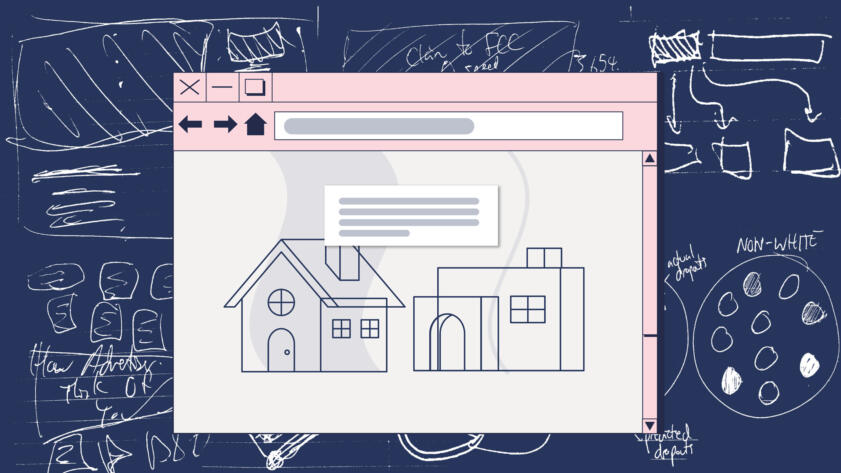
Consider images. We want a CMS to be responsible for storing an image and its metadata (a caption, credit, alt text) and relationships (the stories it’s included in, the user that uploaded it). It is not built to parse or render the contents of the image—that’s left to people, design software, and browsers.
One of the things I really appreciate about the graphics template here is that it’s very open-ended.
Joel Eastwood, visualizations engineer, The Markup
The same goes for graphics. We should design a CMS to be responsible for storing a reference to a graphic and its metadata and relationships but not for the graphic’s functionality or how it’s displayed.
However, the part that trips up some engineers is that they try to anticipate common use cases for journalists and add features to create graphics within the CMS. This is often a Sisyphean task that will leave nobody completely satisfied because of the uniqueness of custom interactives. Just because graphics have some interaction with the CMS doesn’t mean the CMS should be responsible for everything about them.
This separation of concerns shouldn’t extend to the newsroom. We want editorial developers to be able to focus on their work without worrying about how their code could disrupt the product and infrastructure teams, and vice versa. (Although the reality is that everybody does a bit of everything on a smaller team like The Markup.) Ultimately, all of us are responsible for one product, not two disparate products.
Our Process
Before code editors are opened and local environments are launched, a newsroom developer will work with editors and reporters to brainstorm visuals for a piece. This typically means reading a draft and noting opportunities for graphics, The Markup’s visualizations engineer, Joel Eastwood, says.
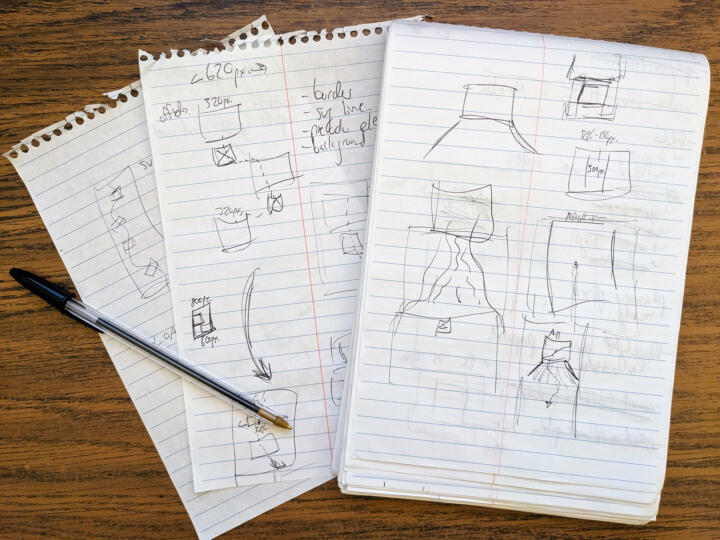
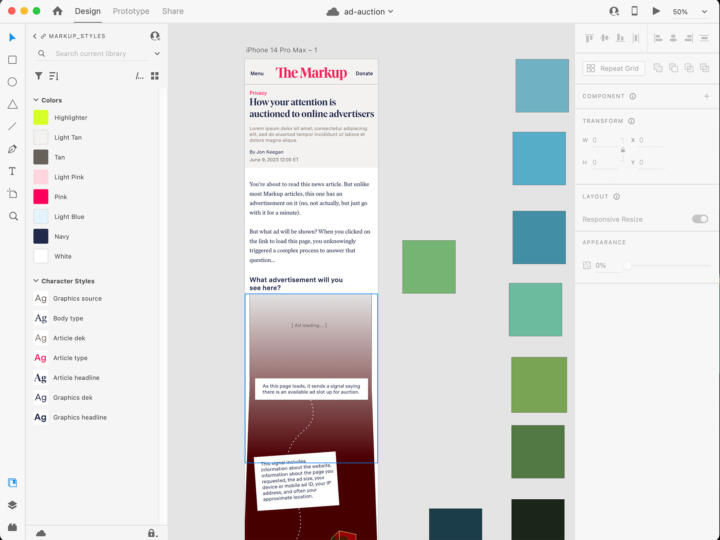
The next step, for more complex graphics, is to create mockups. They usually start as pen-and-paper sketches before moving to a program like Adobe XD.
Once the structure of the visualization has been worked out, Joel copies an evolving graphics template developed over time by various engineers at The Markup. It’s essentially a static site generator, and it’s not particularly opinionated; it includes some basic deployment scripts and out-of-the-box support for compiling styles and templating but doesn’t lock you in to any particular method or library.
“One of the things I really appreciate about the graphics template here is that it’s very open-ended,” Joel says.
Once the graphic is pushed to GitHub, a GitHub Action runs the build step and uploads the results to an S3 bucket, where we host our code. We back up every version of the graphic so we can easily roll back if anything goes wrong.
Back in WordPress, we use a bespoke Advanced Custom Fields (ACF) block that lists all the graphics in our S3 bucket and any backups. Since loading graphics from S3 is a relatively slow operation, templates are cached in the database.
Practical Reasons for This System
In our system, graphics are entirely self-contained. We don’t want to justify small, messy hacks for a purported one-off use case or accidentally make changes that have a disastrous cascading effect.
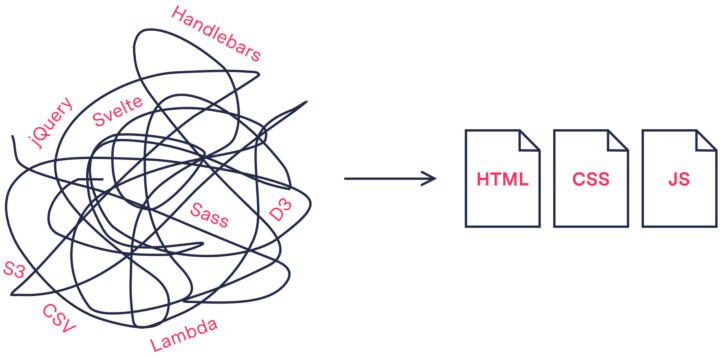
Developers are free to use whatever tools or libraries they desire. Anything that can be bundled, compiled, tree-shaken, statically analyzed, concatenated, or transpiled into HTML, CSS, or JavaScript files is welcome.
The system only needs to handle these three files—three files that enable almost infinite possibilities. (It’s the web—people have simulated entire operating systems and everything in between.)
Our default template was built to reduce boilerplate so the newsroom can quickly create interactives without building projects from scratch each time. The flexibility of the system means that we can modify or create other templates as our team’s tastes and needs evolve. For example, I’m a big fan of Svelte, a front-end framework that’s popular in newsrooms (and was built by Rich Harris when he was a developer at The New York Times). In addition to how intuitive it is, Svelte results in leaner code than other frameworks, which we try to avoid to keep our article pages snappy regardless of device or internet connection.
While working on Blacklight, which is more of an app than a graphic, I modified the template to add support for Svelte. Because the output is all HTML, CSS, and JavaScript, nothing about our WordPress integration had to be changed.

Any changes to the template are applied only to graphics moving forward, and each graphic uses its own copy of the current template. Helper functions and styles from the template, as well as the site’s global stylesheet at the time, are baked into each graphic. Any improvements made to the template—such as adding Svelte—are opt-in and can be easily merged when needed. Once a graphic is created, deployed, and published, it shouldn’t require continued maintenance.
As of this writing, we’ve created more than 300 graphics with this system. If we had to constantly fix bugs as we made changes to the template and site, we would be quickly overwhelmed.
This system allows us to move quickly, keep chaos contained, and prevent chaos in the first place.
Jerome Paulos was a product intern at The Markup for summer 2023. He worked on Blacklight, the new Blacklight API, and the graphics system. He is a rising sophomore at Macalester College.