Introduction
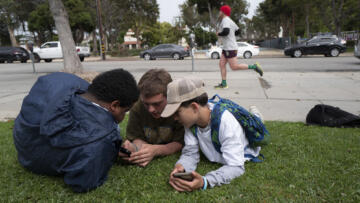
More than 65,000 “people experience homelessness on any given night in LA County,” according to Los Angeles Homeless Services Authority (LAHSA) estimates published last year. Although the rise in homelessness in the region has slowed during the pandemic, LAHSA recently said that it needed a 250 percent increase in available permanent housing in order to quickly and efficiently move people off the streets and out of shelters.
See our data here.
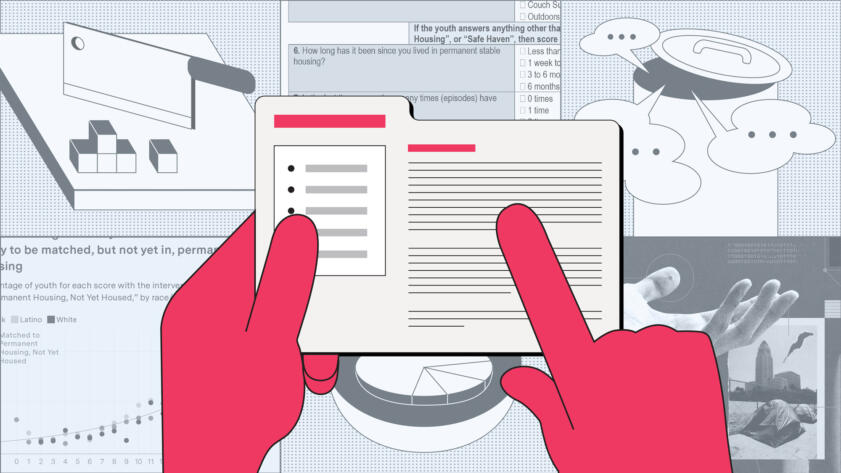
With persistently higher levels of homelessness than available housing, LAHSA, like many other local agencies, employs a prioritization system. In 2013, Los Angeles County’s Coordinated Entry System (which LAHSA later became involved with) began using a survey-based assessment tool called the “Vulnerability Index-Service Prioritization Decision Assistance Tool” (VI‑SPDAT), which was developed by two consulting groups and released earlier that year. The assessment, conducted orally by case managers, poses a series of questions about each interviewee’s living situation and personal history; the answers correspond to certain point values, which are summed into a total “acuity score.” That score is then used by LAHSA and partner organizations to prioritize who should be offered permanent housing. Generally, the higher the person’s vulnerability, as measured by the survey, the greater priority the person is considered for permanent housing and other services.
In 2012, the U.S. Department of Housing and Urban Development published new regulations requiring local housing agencies like LAHSA to use a standardized assessment system that can screen for the most severe cases and “provide meaningful recommendations.” As of 2015, the VI-SPDAT had been adopted by dozens of “communities” (typically regional or local homeless services providers) across the U.S. A HUD “state of the evidence” report published that year identified the tool as one way to fulfill the requirement; it noted that such tools were “evidence informed” but added that “because they are still relatively new, the evidence base is limited.”
Story Recipes
Journalists: Investigate Homeless Vulnerability Scoring in Your City
The survey we investigated was also used in dozens of other cities and counties, according to its creators. Here are our tips for looking into it
Prior research has found racial inequities in VI-SPDAT scores in other communities, and LAHSA itself recommended that the VI-SPDAT and related tools be audited for their impact on Black people. So, using survey response and outcome data from more than 130,000 LAHSA VI-SPDAT interviews, The Markup sought to measure whether different demographics scored differently. This article describes our analyses’ data sources, methodologies, findings, and limitations.
We chose not to publish the raw dataset provided to us by LAHSA, which includes answers to deeply personal questions, to protect the privacy of the individuals included in the dataset. The code we used to clean the raw data, a cleaned version of the data, and all other code we used for these analyses are available on Github.
Data Sourcing, Preparation, and Validation
Data Sourcing
Our analyses are based on a data file provided by the Los Angeles Homeless Services Authority (LAHSA) to The Markup in response to a California Public Records Act request.
According to LAHSA, the file combines assessment information for “All clients in HMIS [Homeless Management Information System] who had a CES Assessment from 2016-01-01 to 2022-10-30” from two databases: the agency’s Case Conferencing Tool and “further Assessment data in HMIS.” Christopher Yee, a spokesperson for LAHSA, wrote in an email to The Markup that, “Only the latest assessment is included for each client, as the underlying data is pulled from our Coordinated Entry System Community Queue,” which Yee wrote relies on the latest assessments people have taken. He also mentioned that some data “uses logic from both RMS [Resource Management System] and HMIS.” LAHSA did not provide documentation to The Markup about which columns in the dataset were from which database.
The dataset The Markup received contains 158,509 rows, each including information about the survey taken and the person who took it between Jan. 2, 2016, and Oct. 30, 2022.
The dataset contains 75 columns, most of which record demographic information about the interviewees (including race, ethnicity, gender, age at time of assessment, and veteran status), their responses to survey questions, metadata about the assessment (such as the assessment version, date, subscores, and total score), and outcome. (All of the score-producing survey items are categorical questions; the data file contains no free-form text.) For a full list of columns, see GitHub.
Data Selection
The dataset includes assessments conducted with three different versions of VI-SPDAT:
- The main VI-SPDAT, referred to as the CES Survey Part 1 in the dataset (127,442 rows)
- The Next Step Tool, a variation of the VI-SPDAT designed for “youth” under the age of 25 (12,489 rows)
- A variation of the VI-SPDAT designed for families (18,578 rows)
We excluded the family assessments from our analyses because the dataset only included demographic information for the head of household and did not have information about how many people were in the family unit. This reduced the number of assessments in our analyses from 158,509 to 139,931.
For the purposes of our analyses, we refer to people assessed with the Next Step Tool as “youth” and the CES Survey Part 1 as “adults,” regardless of actual age, to match the language used to describe the intended demographics for each survey. While the former is designed for people under 25 and the latter meant for single adults, we found that a small percentage of surveys appeared to be administered to people outside the targeted age group. We did not exclude these assessments from our analyses.
Score Validation
The scoring process for both the CES Survey Part 1 and the Next Step Tool involves four general steps, all performed by the person administering the assessment:
- Record the interviewee’s responses to the various assessment questions, using the response options available.
- When prompted by the assessment, calculate individual components of the score based on question responses. For example, questions 8 and 9 of the CES Survey Part 1 ask, “Have you been attacked or beaten up since you’ve become homeless?” and “Have you threatened to or tried to harm yourself or anyone else in the last year?” The assessment follows these questions with instructions to the administrator: “If ‘Yes’ (**) to any of the above, then score 1 for Risk of Harm.” There are 16 such components, each scored either 0 or 1.
- Sum the individual components into subscores for each of the assessment’s four thematic sections, “History of Housing & Homelessness,” “Risks,” “Socialization & Daily Functions,” and “Wellness.”
- Sum those thematic subscores and add them to a pre-survey score of either 1 (for youth ages 17 or younger and adults ages 60 or older) or 0, to reach a total score that can range from 0 to 17.
The data file received by The Markup indicated, for each assessment taken, the responses to each score-producing question, the pre-survey/general information score, score subtotals for the four thematic sections of the survey, and two versions of the total acuity score: “TOTAL_SCORE” and “AcuityScore.”
We found 232 instances where the “TOTAL_SCORE” variable did not match the “AcuityScore” variable. LAHSA did not respond to our request for clarification about the difference between the two variables, so it is difficult to say why these discrepancies exist. We used “TOTAL_SCORE” instead of “AcuityScore” in our analyses because “TOTAL_SCORE” appeared to correspond more directly to the answers provided in response to the survey questions.

The data file we received also did not indicate the score assigned for each of the 16 individual score components. For this reason, we attempted to calculate the 16 score components for every assessment using the question responses provided. To match each response to the appropriate score, we consulted version 3.9 of the CES Survey Part 1 and version 4.3 of the Next Step Tool. We checked these calculated scores against the dataset’s section subtotals and total score.
When we added up our version of the scores, they matched the listed total score (“TOTAL_SCORE”) 98.9 percent of the time. The discrepancies were as follows:
- For the CES Survey Part 1, our calculated total score did not match the total score listed in the dataset in 1,569 instances (1.2 percent). In all but three of those instances, we traced the entirety of the discrepancy to a mismatch between our calculated section subtotal for “History of Housing & Homelessness” and the section subtotal listed in the dataset.
- For the Next Step Tool, our calculated score did not match the total score listed in the dataset in 30 instances (0.2 percent). The discrepancies all appear to occur in the “History of Housing & Homelessness” section.
Because “TOTAL_SCORE” appears to be the definitive score for assessments, we used that variable for all analyses evaluating total scores rather than using our own calculated total score. Using our own calculated score did not result in substantially different findings.
“Acuity Group” Categorization
For our analyses, we categorized assessment scores into three groups: Low Acuity, Mid Acuity, and High Acuity. We defined these groups in the same way as a June 2020 report from LAHSA that analyzed the distribution of households by acuity, which itself echoes a CES Prioritization Policy adopted in 2018. We used the following rubric to categorize assessment results:
Race/Ethnicity Categorization
The data provided by LAHSA uses separate variables to represent race and ethnicity. LAHSA itself merges the two variables in published reports, such as the 2022 Homeless Count Data Summary. We chose a similar approach but merged some groups due to small sample size:
- When respondents had an ethnicity of “Hispanic/Latin(a)(o)(x),” we classified them as Latino regardless of race, including if the race variable was set to “Unknown.”
- We classified Black, Asian, and White respondents as such if their ethnicity was specified as “Non-Hispanic/Non-Latin(a)(o)(x).”
- We classified all respondents with “Unknown” ethnicities as “Unknown,” as well as non-Latino respondents with “Unknown” races.
- We classified all other non-Latino respondents with races of “American Indian, Alaska Native, or Indigenous,” “Native Hawaiian or Pacific Islander,” and “Multiple Races,” as “Other” due to their small sample sizes.
We focused our analyses on Black, White, and Latino respondents because, combined, those groups account for more than more than 90 percent of the entries for both adult and youth surveys in the dataset.
Analyses
Acuity Group Distributions by Race
We sought to measure whether different demographics were more or less likely to qualify for the highest acuity group.
Of those assessed between January 2016 and October 2022, we found that 32 percent of White adults had high acuity scores, compared to 26 percent of Black adults and 28 percent of Latino adults.
A chi-square analysis of acuity groups by race suggests that there is a statistically significant difference in how often White adults are considered high acuity (versus non–high acuity) compared with Black adults and compared with Latino adults.
(As can be seen in the chart above, there is a jump in frequency between assessments with a total score of seven versus eight. A deeper analysis of this phenomenon is outside the scope of this methodology; one possible lead to explore is that the CES Survey Part 1 states that scores of eight or above should result in an assessment for Permanent Supportive Housing/Housing First. Our definition of “High Acuity” is based on a 2020 report on the subject from LAHSA; see the “Acuity Group” Categorization section above for more details.)
Although the overall proportion of adults receiving high acuity scores has increased over time, we found a persistent gap between the proportion of White and Black adults, as well as White and Latino adults, who received those high acuity scores. In 2021, 39 percent of the White adults assessed that year had high acuity scores, compared with 35 percent of Latinos and 33 percent of Black adults.
We found similar trends among people who took the youth assessment.
Similar to our findings with adults, a chi-square analysis of acuity groups by race suggests that there is a statistically significant difference in how often White youth are considered high acuity compared with Black and Latino youth.
As with those who were assessed with the CES Survey Part 1, we found that the proportion of youth who got high acuity scores each year increased over time, with consistent gaps between the proportions of White and Black youth who would be considered high acuity based on their scores.
Logistic and Linear Regressions of Demographic-Score Relationships
To check whether these disparities might be explained by other variables in the dataset, we performed a series of logistic and linear regressions. In addition to race/ethnicity, we included the year people were assessed, whether or not they were male, whether or not they were a veteran, and the Service Planning Area in which they were located. For adults, we also factored in whether a person was 60 or older at the time of the assessment, which is the condition for the pre-survey score. For youth, we factored in whether or not they were minors.
For adults, we conducted a linear regression with the total acuity score as the dependent variable as well as a logistic regression in which the dependent variable was whether someone’s score put them in the high acuity group. In both cases, the disparities persisted (although moderated slightly) between Black and White respondents and between Latino and White respondents after adjusting for the other variables.
While outside the scope of our research due to the much smaller sample size of Asian respondents compared to other groups, we also found substantial disparities between Asian and White respondents. These results warrant further investigation.
We conducted similar regressions for youth assessment and found similar results.
For the full output of our regressions, please refer to this computational notebook in GitHub.
Subscores
Are these disparities driven by a small number of questions or sections of the VI-SPDAT assessments? Generally speaking, they do not appear to be. As noted above, there are 17 scoring components of the VI-SPDAT for adults and youth, each of which can be scored 0 or 1. For each of those 17 components, we calculated the proportion of people whose responses received a 1 and compared those rates for White, Black, and Latino interviewees.
We found that Black adults consistently had lower scoring rates for each component compared with White adults. The largest difference was for the “Substance Use” component. Using our calculated scores, we found that 24 percent of Black adults received a point based on their responses, compared with 35 percent of White adults. We also found large differences in the “Physical Health” (an 8 percentage-point difference), “Mental Health” (7 percentage points), and “Emergency Service Use” (7 percentage points) components:
The disparities were similarly pervasive across subscores among youth, although for some components the gaps were even larger. The biggest was for “Mental Health,” where we found that 30 percent of Black youth would have received a point for the component compared with 45 percent of White youth, a difference of 15 percentage points, followed by “Substance Use” (13 percentage points) and “Risk of Exploitation” (12 percentage points):
A small percentage of these assessments had discrepancies between our calculated History of Housing section score and the section provided. (See the Score Validation section above for more details.) Excluding those assessments resulted in no substantial changes. See GitHub for more details.
Permanent Housing Outcomes
The data file LAHSA provided us included the current “Intervention” for each person at the time the file was generated—outcomes such as “Exited to an institutional destination,” “Currently active in ‘Transitional Housing’ program,” “Exited to a permanent destination,” and “Deceased.” LAHSA provided The Markup a full list of interventions and their definitions, as well as further information on a few specific definitions
Unfortunately, having only the current intervention (rather than the full history of interventions) prevents many analyses we would have liked to conduct and imposes substantial limitations on others, which we discuss further below. Still, one outcome seemed to shed light on the use of acuity scores: “Matched to Permanent Housing, Not Yet Housed.”
For each possible total score, we calculated the proportion of people receiving that score who had this intervention status. We found that people with higher scores were labeled as “Matched to Permanent Housing, Not Yet Housed” more often than people with lower scores, a pattern that fits with how acuity scores are intended to be used and how people who are responsible for matching people to housing told The Markup the selection process works.
Overall, less than 9 percent of people who scored an 11 on the adult version of the survey (the highest end of the “Mid Acuity” category) between January 2016 and October 2022 had an intervention of “Matched to Permanent Housing, Not Yet Housed,” while more than 33 percent of people who scored a 17 had that intervention.
We found similar, albeit noisier, results among youth respondents.
Among the 139,931 rows corresponding to the adult and youth assessments, 86,953 listed an intervention date. Of those, 4,826 intervention dates predated the listed assessment date, which may be an indication of a reassessment. For the people with interventions that predate their assessments, the most common interventions were “Exited to an other or unknown destination,” “Permanently Housed,” and “Exited to a temporary destination.” For our analyses of interventions and how they relate to assessments, we excluded interventions without dates and with dates predating assessment dates, or 41 percent of the 139,931 rows.
While there is also a “Permanently Housed” intervention, LAHSA spokesperson Christopher Yee told The Markup in an email that LAHSA has multiple definitions for the category. We cannot discern from the data we have whether someone who is “Permanently Housed” obtained housing after being matched because of their score or through some other method, such as being given a housing voucher and later securing housing themselves, and we have no way of telling what is the most frequent route to housing.
In general, we found that there were too many caveats to draw substantial conclusions about the role scores play in whether a person is prioritized for housing:
- Because the “Intervention” column only contains the current intervention and not a history of interventions, people who were matched to housing resources because of their scores but later had a different outcome may not be adequately included in an analysis. Research has found, for instance, that it is not uncommon for someone to return to interim housing or street homelessness after being in permanent supportive housing.
- The dataset also does not contain many relevant details, such as whether a case manager advocated for a particular intervention during the case conferencing process or whether the person being assessed had an eviction record, which can limit housing options. People can also choose to reject permanent housing offers.
- Further issues include a lack of information in the dataset about housing availability and requirements, which could affect a person’s outcome and potentially the amount of time it would take to achieve an intervention.
Limitations
There are limitations to our analyses, some of which we have described above (such as the scoring discrepancies in the data file). Other limitations include:
- People can be reassessed, but the data file provided by LAHSA does not indicate whether a row represents an initial assessment or a reassessment.
- As other research has noted, factors like the kind of environment where an assessment is conducted, and the amount of training given to an assessor, can affect scores. We do not know who performed any particular assessment or in what setting it was conducted.
- Other data not available and/or not analyzed might complicate the patterns we have observed. (As noted in the section above on regressions, however, we did see similar patterns when we accounted for other demographic information such as age and veteran status, and contextual factors such as what year and where a person was assessed.)
- Qualitative research has also found that some questions included in the VI‑SPDAT can be unclear or uncomfortable for respondents to answer, leading people to answer in ways that might not accurately reflect their situation.
Los Angeles Homeless Services Authority Response
LAHSA spokesperson Christopher Yee said in an email to The Markup that the agency was aware of the “troubling racial disparities” in its assessment system and has limited the use of the adult survey, which, Yee wrote, was “now focused on permanent supportive housing placements.” In the email, Yee also noted that LAHSA has been working with researchers for years to develop a new assessment tool.
“In 2019, LAHSA partnered with the United Way of Greater LA and researchers from USC and UCLA to evaluate our current CES system, launching the CES Triage Tool Research and Refinement Project,” Yee wrote.
Though LAHSA did not specifically address our questions about the persistent score disparities we found between Black and White people for both the Next Step Tool and CES Survey Part 1 assessments, Yee said in the email that researchers associated with the project found similar issues.
“One key finding of Project researchers was that the current CES assessment tool did have the potential to advantage certain racial groups over others, but that those effects were not actually reflected in housing placements,” he wrote.
While data provided by LAHSA included some outcome data, it did not include enough detail for The Markup to draw any conclusions about the relationship between a person’s score and whether that person was ultimately matched to housing
LAHSA did not respond to our requests for a data dictionary, though Yee provided some additional context about the intervention-related columns.
Conclusion
We found statistically significant differences between the proportion of Black versus White youth who received high acuity scores between January 2016 and October 2022. There was a smaller but still statistically significant difference for Black versus White adults. Latino youth and adults had high acuity scores more often than their Black counterparts but less often than White youth and adults. These disparities persisted when disaggregated by year.
We found that higher total scores were associated with higher rates of someone’s current intervention being listed as “Matched to Permanent Housing, Not Yet Housed” for the adult survey, although that finding comes with substantial caveats. Further investigation into how frequently people are given housing resources through CES because of their scores is warranted.