Facebook’s ad platform is an essential tool for political campaigns. President Donald Trump and former vice president Joe Biden’s 2020 presidential campaigns have spent a combined $175,325,675 on Facebook ads through Oct. 13 this year, according to Facebook data. That’s compared to about $750 million on television ads this year so far, according to Advertising Analytics.
Review Our Code
Unlike traditional media, however, Facebook charges campaigns wildly varying prices for each ad on its platform, with some ads costing a few dollars per thousand views and others costing more than $100 per thousand views. Our analysis of ads run between July 1, 2020, and Oct. 13, 2020, found that the differences also varied by candidate: Joe Biden’s campaign was charged more on average than President Donald Trump’s was. The Biden campaign would have saved $8 million if Facebook had charged him the same rate as it charged Trump.
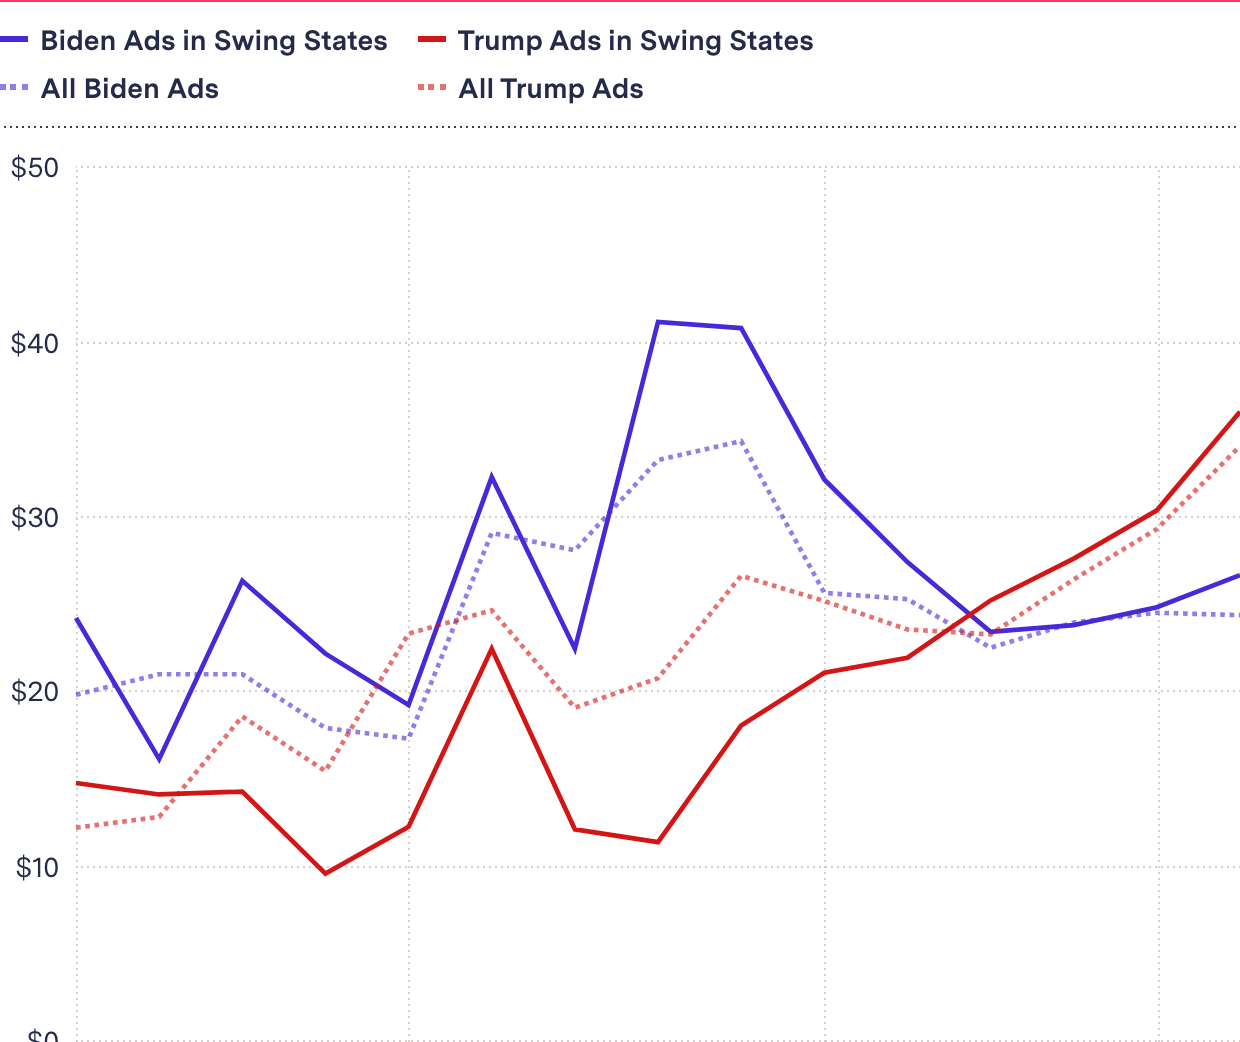
Over all, for each 1,000 times an ad was shown, Biden paid an estimated $25.52 on average, and Trump paid $23.09, an 11 percent difference.
The difference was starker for ads targeted at Facebook users in swing states, particularly during June and July, when Biden paid an average of $34.34 per 1,000 views, more than double Trump’s average of $16.55
Calculating ad prices per thousand views—called the cost per mille, or CPM—is a common advertising industry metric.
Average Weekly Cost per 1,000 Ad Impressions
$0
$10
$20
$30
$40
$50
July
August
September
October
These numbers are based on estimates of the prices paid—because Facebook discloses ranges, not the precise values needed to calculate the exact prices. We explain below how we calculated those estimates.
We analyzed these ads over time and also divided the ads into two groups, those shown primarily to swing-state voters and those that were shown nationally or mostly in other states.
For swing-state ads started between Sept. 1 and Oct. 13, Biden paid a little bit less, $25.19 to Trump’s $28.21.

Ads in swing states are a crucial tool for persuading voters and getting out the vote in a presidential election, while ads in non-swing states are more often related to campaign fundraising, political campaign strategists said.
Biden ran 51,844 ads on Facebook in the period examined, while Trump ran 289,650. (Facebook doesn’t offer bulk discounts, so the number of ads doesn’t directly affect their pricing. Both candidates ran tens of thousands of ads on which they spent very little money.)
Of those, 15,247 Biden campaign ads and 105,432 Trump campaign ads were targeted mostly at swing states.
Our Data Sources
We examined all ads from the Trump and Biden campaigns from July 1, 2020, to Oct. 11, 2020, using data from Facebook’s Ad Library, provided by the NYU Online Political Transparency Project.
Most companies—like Verizon and Hulu—do not publicly share information on political ads placed on their platforms. Facebook is an exception in this area, and its disclosures are more detailed than Google’s.
The company publishes each ad that it or advertisers deem political along with some metadata on its Ad Library site and in an API. This includes a start date, range of amount paid per ad (e.g., $15K–$20K), a range of the number of impressions (e.g., 800K–900K or >1M), and the proportion of spending directed to each state. (Below we’ll explain how we used the state data to calculate ad costs in swing states.)
What a candidate ends up spending on an ad is the sum of the amount Facebook charges each time it’s shown. The price for online ads is often expressed as the cost for every 1,000 “impressions”—meaning each 1,000 times the ad actually appears on Facebook.
Facebook does not disclose in its ad library one key piece of information: whom the ads were targeted at using its audience microtargeting tools. Nor does it disclose a campaign’s “objective”—whether it’s just getting its ads in front of the voters, or other goals like raising money, gathering email addresses, or getting users to watch a video all the way through.
Each ad is associated with a Facebook page, the name of which appears on the ad. For our analysis, we included ads from campaign pages that were paid for either by the candidate’s official campaign committee or by the candidate’s joint-fundraising committee, which is a collaboration between the party and the campaign committee.
Both candidates have numerous official campaign pages on Facebook. In addition to Trump’s personal page, plus his running mate’s page, the Trump campaign has 24 more official pages—such as Evangelicals for Trump, Trump for Pennsylvania, and Promises Made Promises Kept. The Biden campaign has nine: his, Senator Kamala Harris’s, and Beat Trump Fund, plus seven variations on the phrase “Biden Harris for Wisconsin.” (The pages are listed in the Appendix, at the end of this article.)
We didn’t include ads run from pages of other brands (like Allure or Wired) but paid for by the campaigns.
Determining "Swing-State Ads"
We categorized swing states as those labeled “Lean” or “Toss Up” in the Cook Political Report as of Sept. 29. About 40 percent of the U.S. population lives in those states.
Some ads were delivered only to residents of those states, but for others, Facebook reported showing them to residents of both swing states and non-swing states. For those, we calculated the proportion spent on people in swing states relative to the proportion of the U.S. population that lives in those states. (Facebook doesn’t disclose the advertiser’s intent about where to spend on the ads but instead only the results—where the ad was actually shown.)
We classified an ad as swing state if at least 60 percent of its cost went to show it to people in swing states—that’s 1.5 times the proportion of the U.S. population that lives in those states.
This heuristic provides substantial separation between the two ad types; note in the chart below how the distribution of the amount spent per ad in swing states versus non-swing states is bimodal, with peaks at around 40 percent and around 100 percent.
% of Ads
Swing State Spend Proportion
% of Ads
Swing State Spend Proportion

Calculating Cost Per Mille
Because Facebook only reports ranges for what the candidate ended up spending and how many times each ad was shown (an “impression”), we had to estimate each figure. We used the midpoint of Facebook’s provided range to do so.
One of our challenges was calculating the CPM of ads with more than one million impressions, which could have an unbounded number of impressions, and ads with under $100 of spending, which could have cost pennies, a few dollars or tens of dollars. For that reason, we ignored ads on these two extremes.
We ignored a total of 28,484 ads from Biden and 229,052 from Trump because they cost an unknown amount of money under $100 each or had fewer than 1,000 impressions, making their cost difficult to estimate with available data. We ignored another 311 ads from Biden and 437 from Trump because they had an unknown number of impressions over one million, which also made their cost difficult to estimate. (No ads during the window had more than $1 million spent on them; if there had been, we would have excluded those, too, since Facebook would have reported the amount spent as “over 1 million,” making the true cost difficult to estimate.)
That left 22,522 ads from Biden and 60,737 from Trump for which we had enough data to estimate the price.
Of those, 8,996 from Biden and 21,888 from Trump were swing-state ads under our definition.
We used the spend estimate and impression estimate for each ad to calculate the CPM. We did so by dividing the spend-estimate midpoint by the impression-range midpoint, and multiplying the result by 1,000.
To confirm the pattern, we revisited the previously discarded ads with more than one million impressions because, while we don’t know if they had just a few more, like 1.1 million impressions, or far more, like eight million, we do have a sense of the ad’s total cost. The results here are only suggestive but correspond with the results shown by the mean of the ads that had proper ranges: In July and August, Biden’s average cost for his 135 ads with one million or more impressions was $54,000, and Trump’s was $22,931, for 367 ads.
In September and early October, Biden’s average cost for his 172 ads with one million or more impressions was $31,599, and Trump’s was $38,824, for 68 ads.
Facebook Response
Facebook spokesman Joe Osborne said in a statement to The Markup, “This article reflects a misunderstanding of how digital advertising works. All ads, from all advertisers, compete fairly in the same auction. Ad pricing will vary based on the parameters set by the advertiser, such as their targeting and bid strategy.”
Osborne didn’t mention other factors that Facebook has publicly said affect pricing, including its relevance algorithms.
Conclusion
We found Biden, on average, paid more for his ads than Trump did. Facebook says that pricing for ads varies based on parameters set by the advertiser and Facebook’s instant auctions system. The company has also said in the past that it subsidizes ads that its algorithms view as more engaging. Without greater transparency as to how Facebook prices ads, we cannot say conclusively why the difference in prices charged to the presidential campaigns occurred.
Appendix: Pages for Each Candidate
For our analysis, we included ads from campaign pages that were paid for either by the candidate’s official campaign committee or by the candidate’s joint-fundraising committee, which is a collaboration between the party and the campaign committee. We didn’t include ads from the party paid for by the joint-fundraising committee.
(It’s not clear why the Biden campaign ran ads from seven Wisconsin-specific pages but does not appear to have created such pages for other states, nor run ads from them.)
Trump:
- Donald J. Trump
- Mike Pence
- Trump for Ohio
- Trump For Iowa
- Trump For North Carolina
- Trump for Pennsylvania
- Katrina Pierson
- Team Trump
- Evangelicals for Trump
- Trump for Nevada
- Trump for Arizona
- Women for Trump
- Promises Made Promises Kept
- Trump For Minnesota
- Trump For Florida
- Trump for Wisconsin
- Lara Trump
- Trump For Georgia
- Veterans for Trump
- Trump For Michigan
- Brad Parscale
- Latinos for Trump
- Virginia for Trump
- Trump For Nebraska
- Team Trump Store
- Black Voices for Trump
Biden: