
This article is copublished with
This story was copublished with Chalkbeat, a nonprofit news organization covering public education. Sign up for its newsletters here.
Last summer, administrators at Bradford High School in Kenosha, Wis., met as they do every year to plan for the incoming class of ninth graders. From a roster of hundreds of middle schoolers, assistant principal Matt Brown and his staff made a list of 30 to 40 students who they suspected might struggle the most to graduate.
See our data here.
Over the course of the summer break, Brown and his team went down the list and visited each child’s home. The staff brought T-shirts for the students, introduced themselves to parents, left behind their contact information and, they hoped, a positive first impression.
“It’s like, ‘Hey, we want to hook you up with some Bradford gear. You’re gonna be part of a Bradford family now,’ ” Brown said. “It’s kind of coming out from that standpoint of, ‘Hey, we’re here to support you,’ not necessarily, ‘Hey, your kid really messed up last year’ … because we don’t want parents to feel like you’re already labeling their kid as somebody that’s a troublemaker.”
But in most cases, the students on Bradford’s list for summer visits land there because of a label—“high risk”—assigned to them by a racially inequitable algorithm built by the state of Wisconsin, one that frequently raises false alarms.
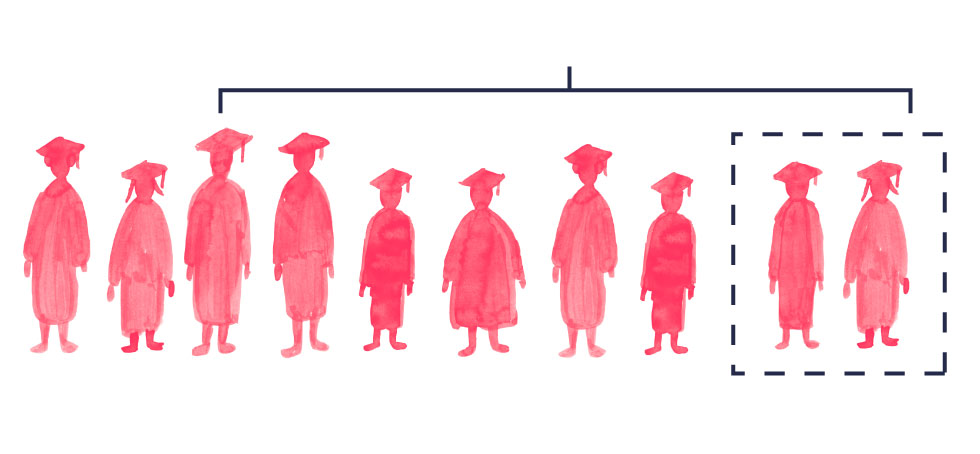
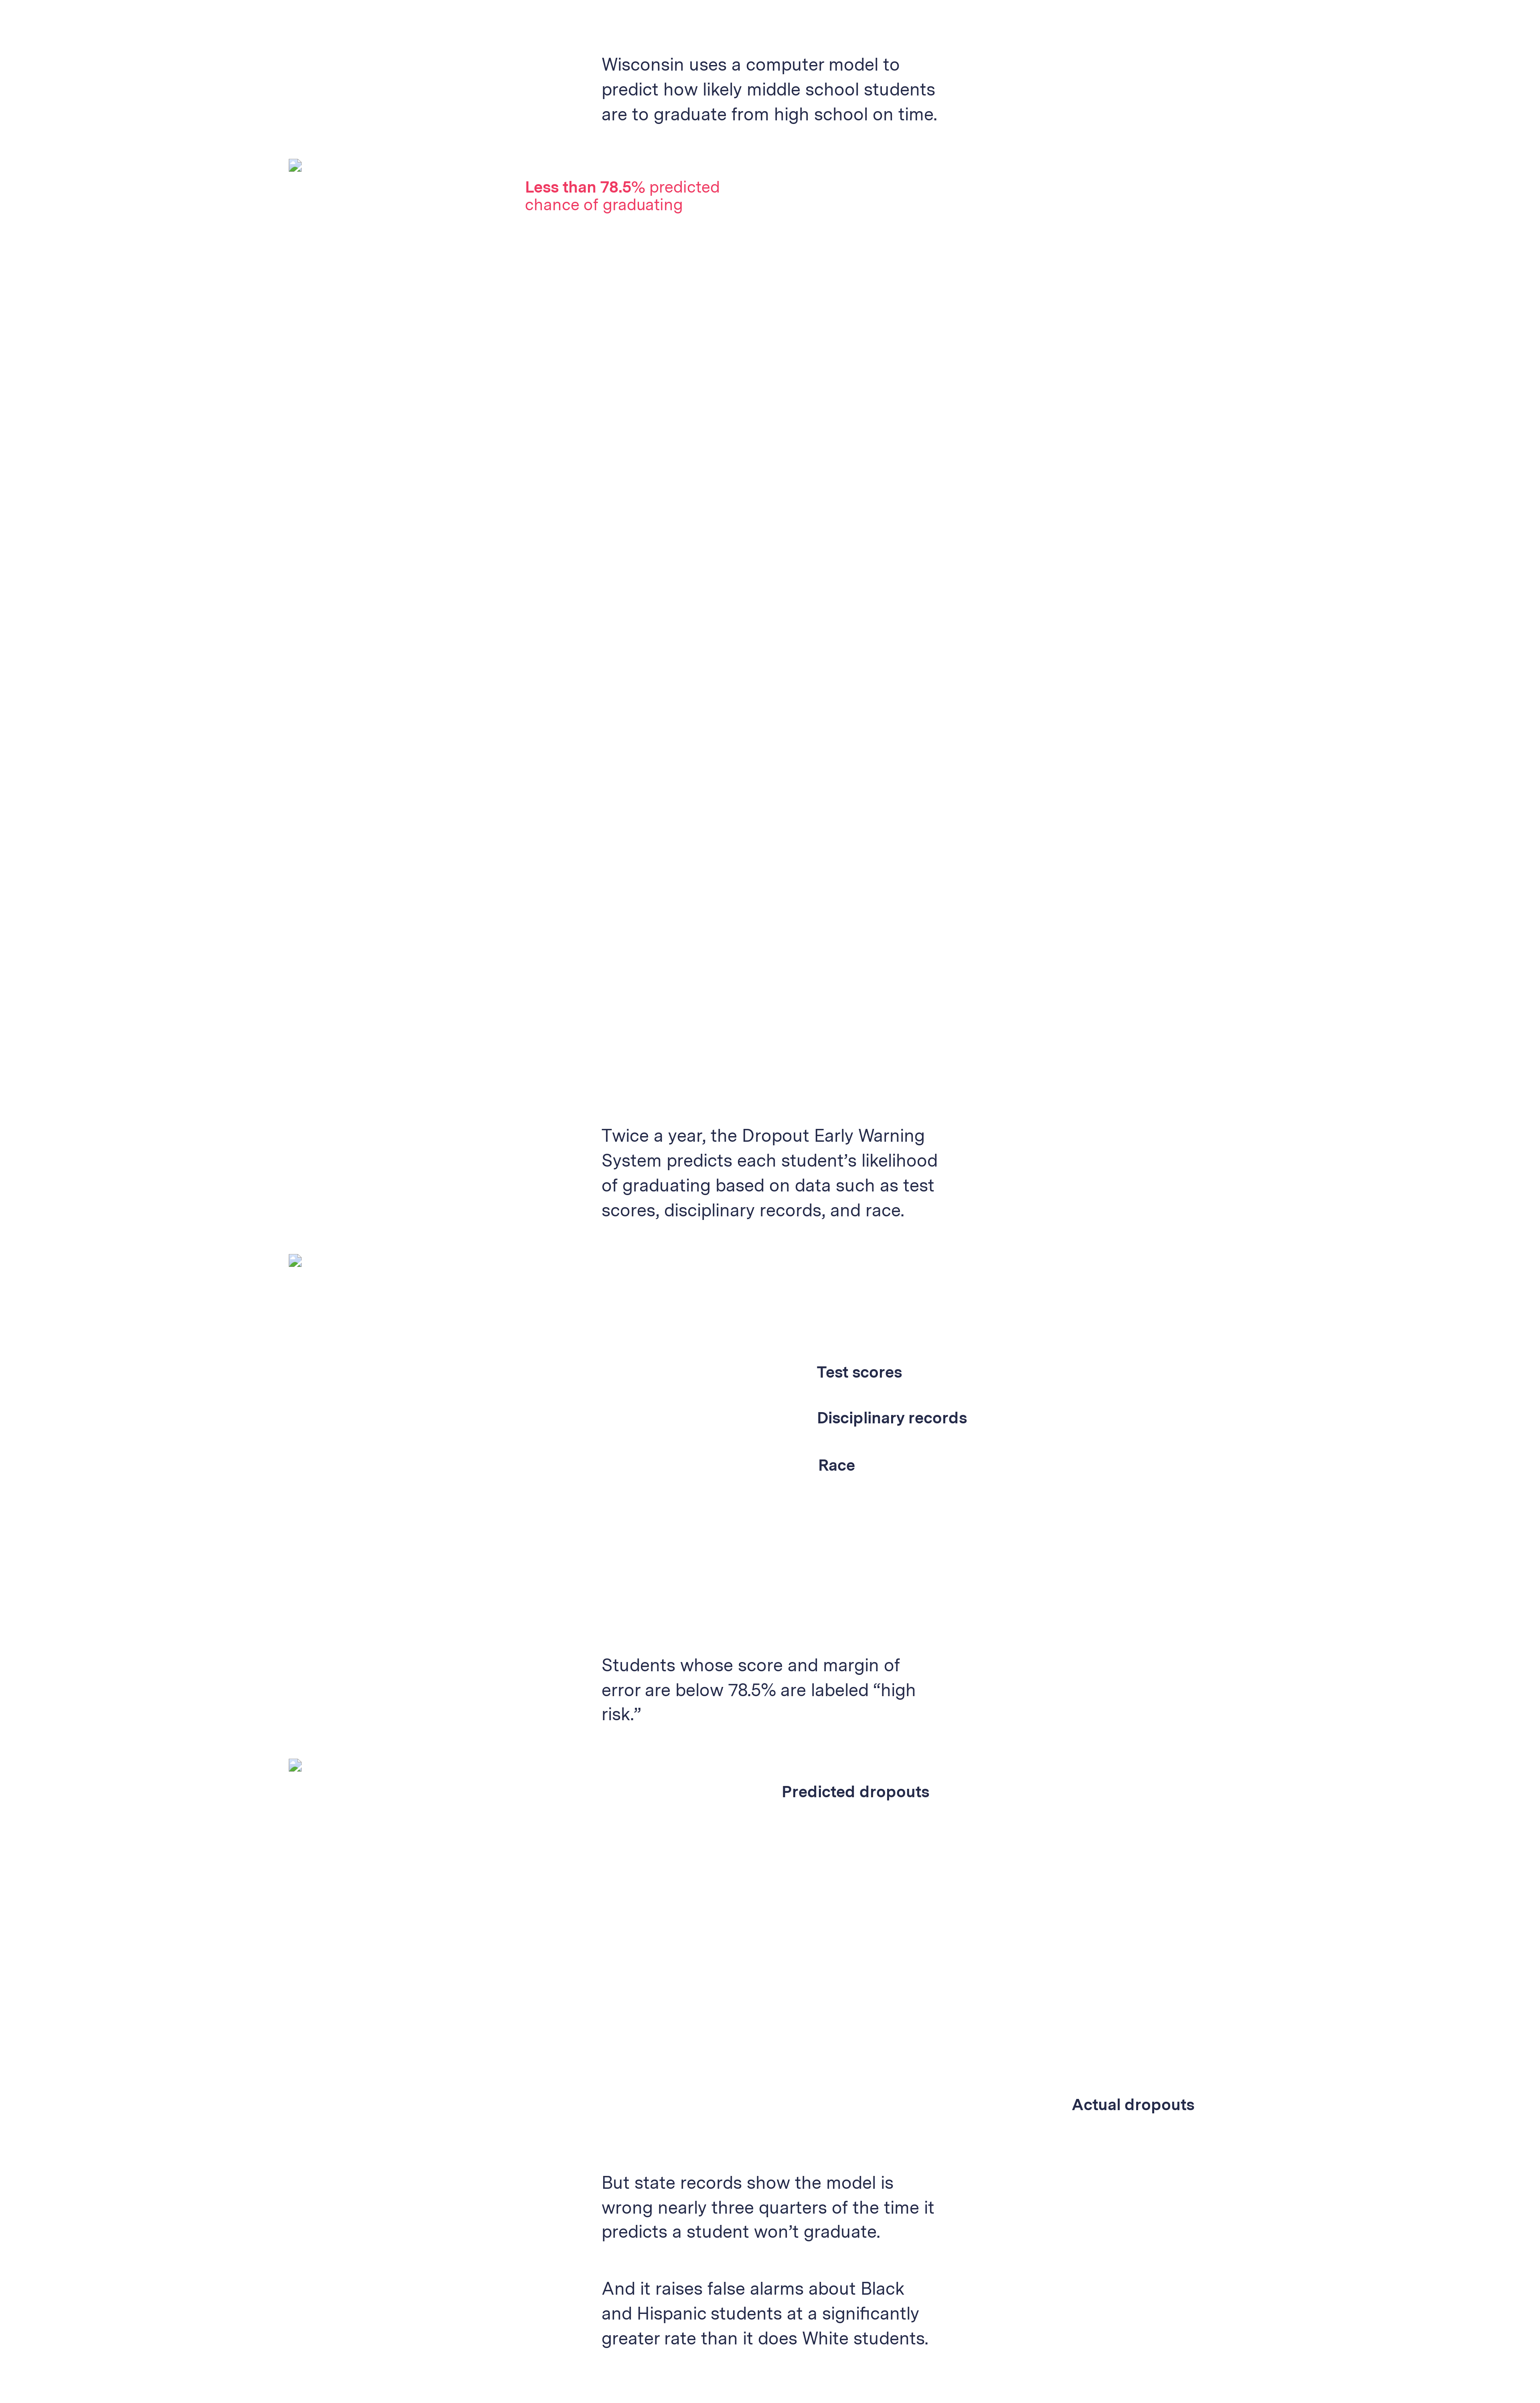
Since 2012, Wisconsin school administrators like Brown have received their first impression of new students from the Dropout Early Warning System (DEWS), an ensemble of machine learning algorithms that use historical data—such as students’ test scores, disciplinary records, free or reduced lunch-price status, and race—to predict how likely each sixth through ninth grader in the state is to graduate from high school on time.
Twice a year, schools receive a list of their enrolled students with DEWS’ color-coded prediction next to each name: green for low risk, yellow for moderate risk, or red for high risk of dropping out.
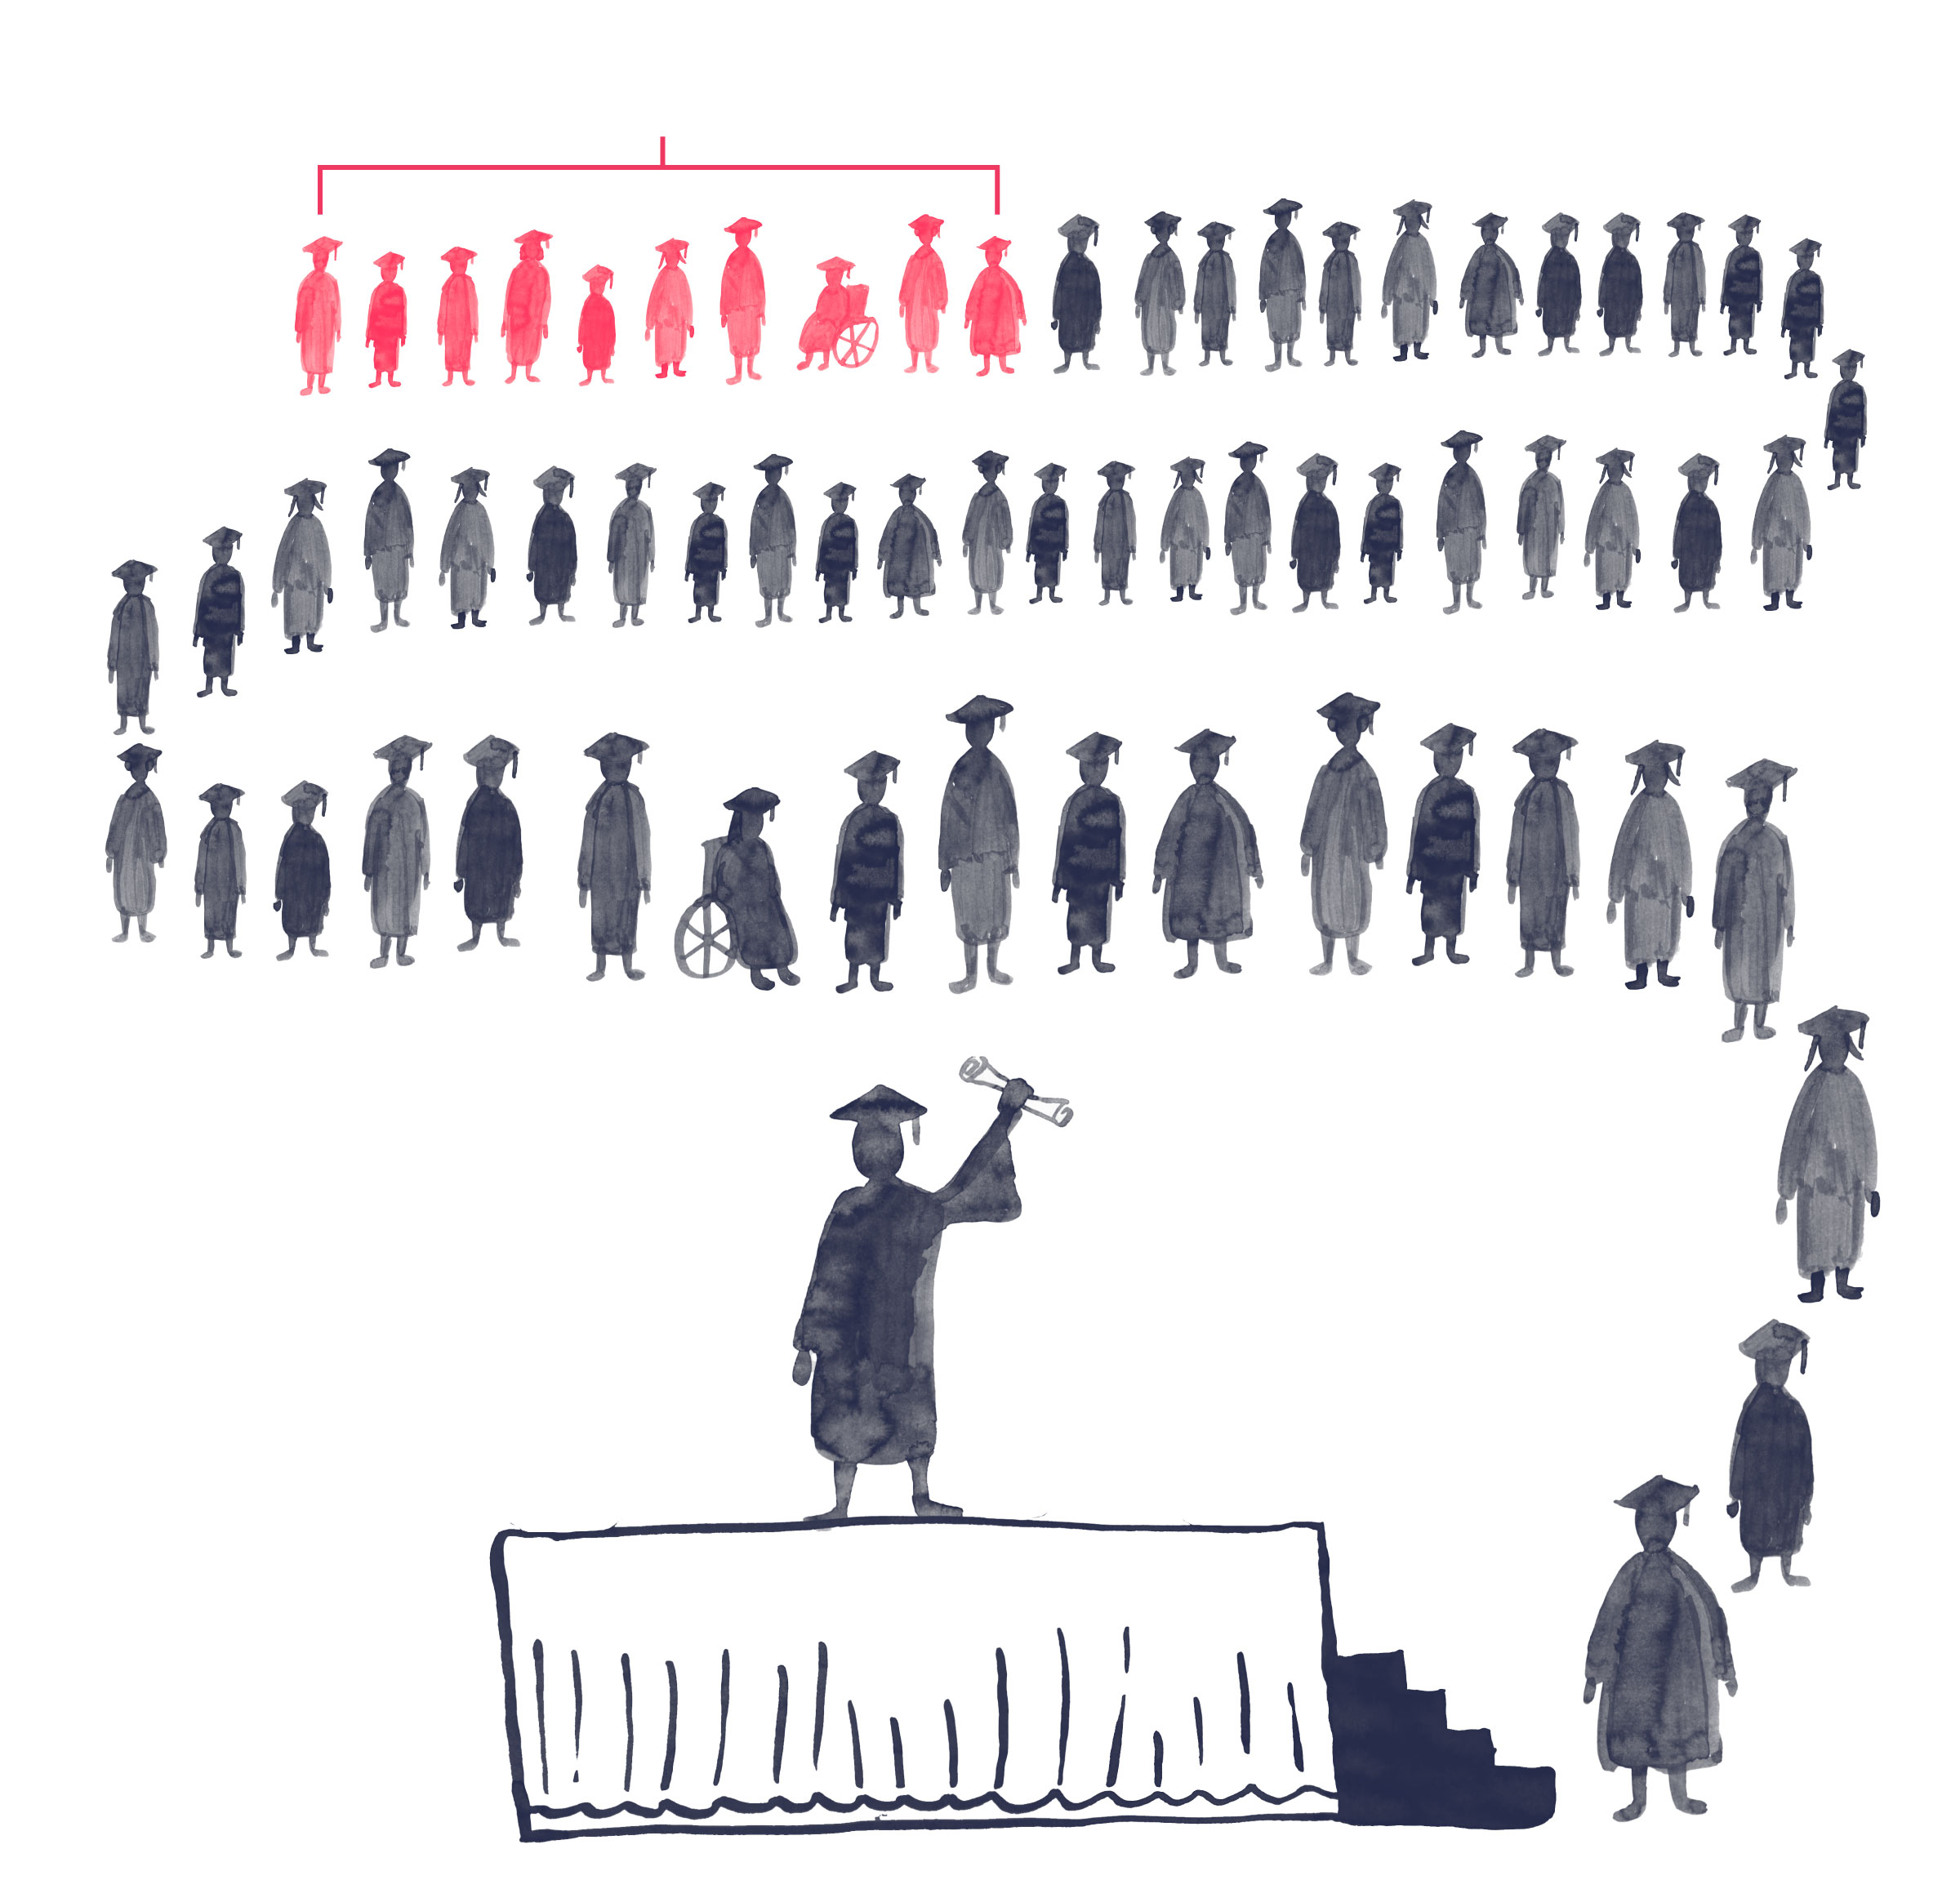
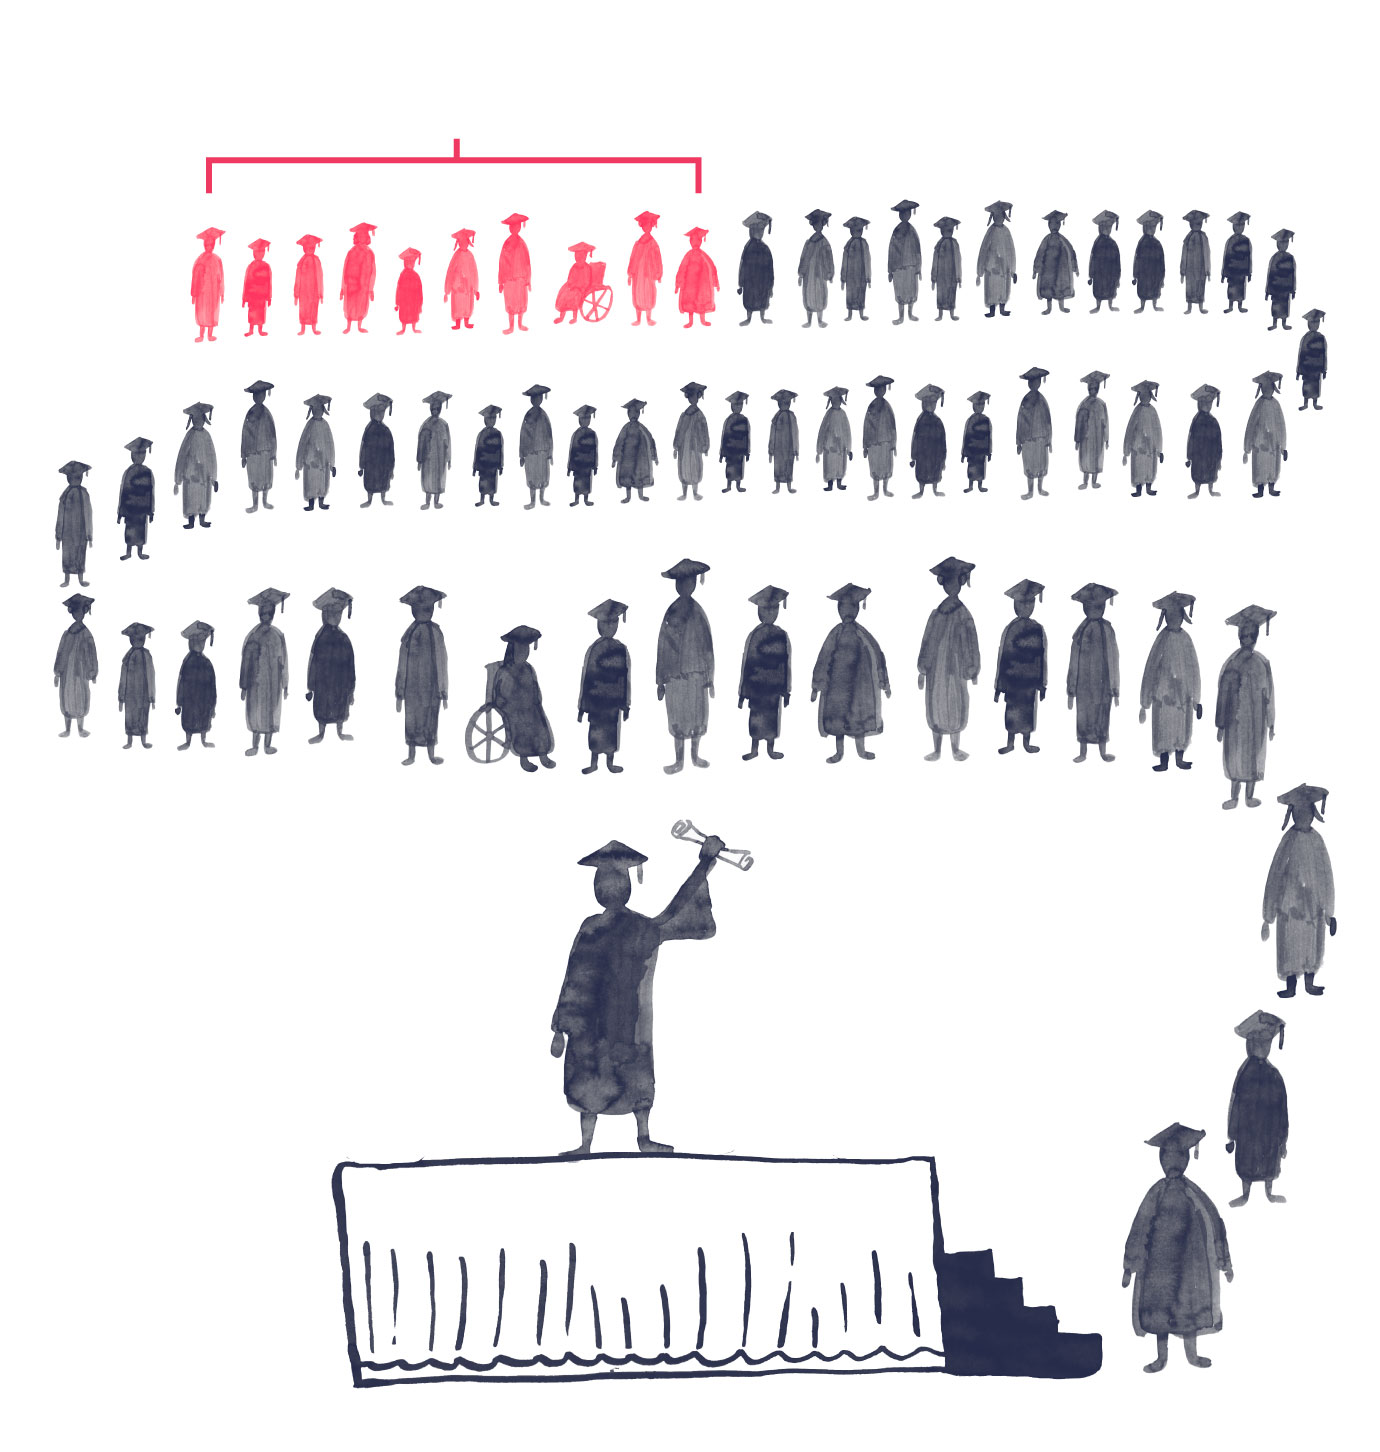
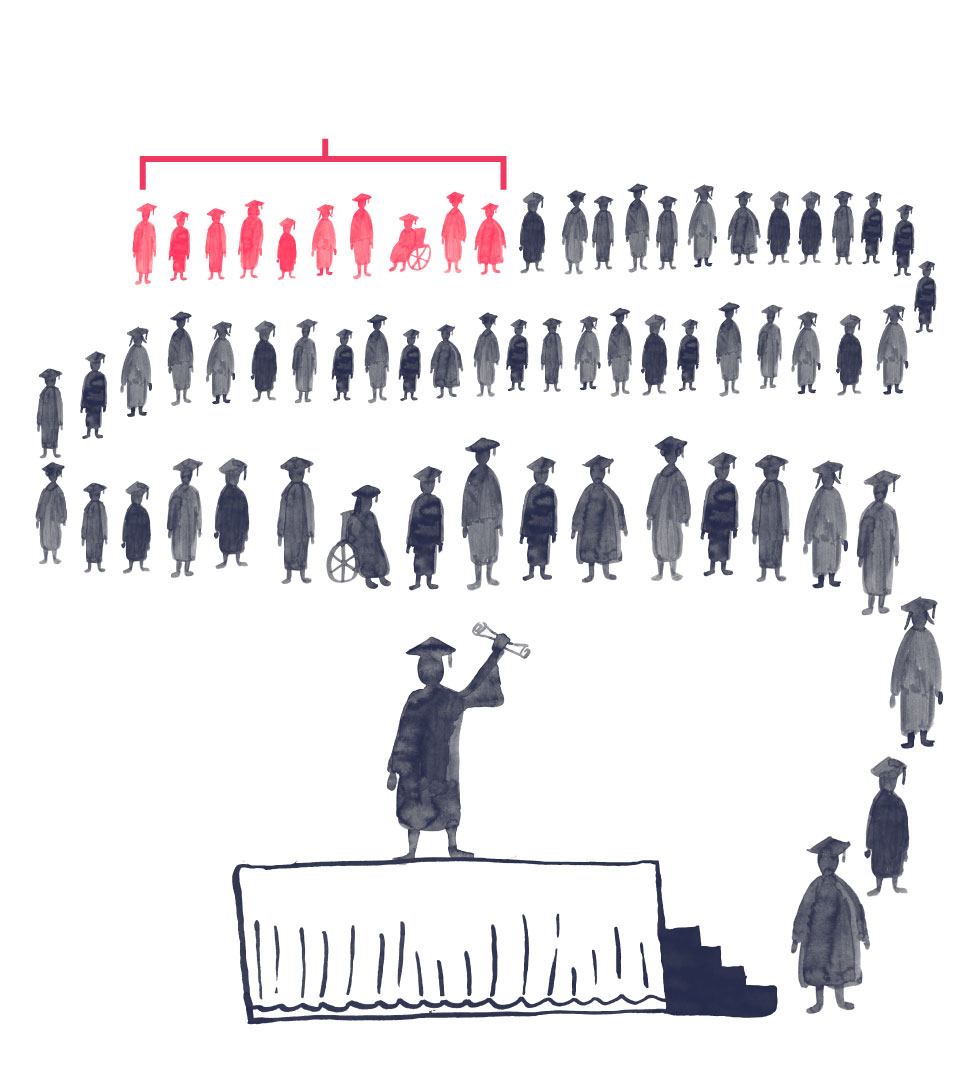
Education officials once held up DEWS as a key tool in their fight against the state’s graduation gap. While 94 percent of White students graduated on time last year, only 82 percent of Hispanic and 71 percent of Black students completed high school in four years. DEWS was intended to put personalized predictions in the hands of educators early enough that they could intervene before a child showed obvious signs of falling off track.
The BreakdownMachine Learning
Takeaways from Our Investigation into Wisconsin’s Racially Inequitable Dropout Algorithm
Wisconsin’s Dropout Early Warning System (DEWS) scores every middle schooler based on income, race, and more
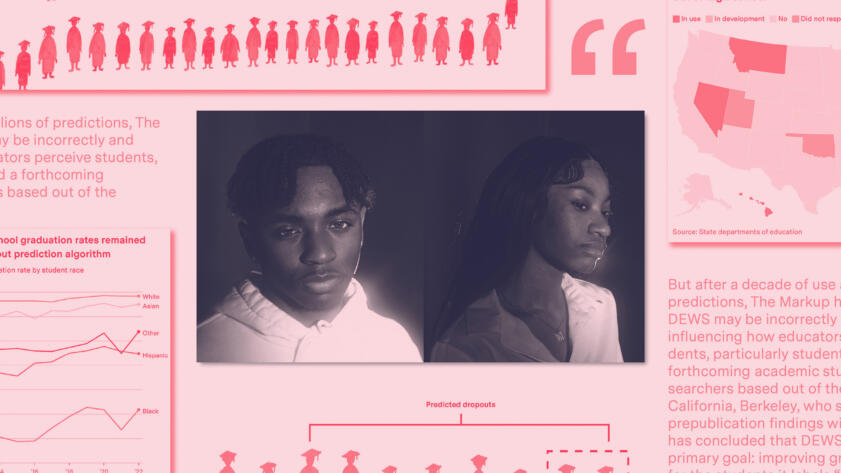
But after a decade of use and millions of predictions, The Markup has found that DEWS may be incorrectly and negatively influencing how educators perceive students, particularly students of color. And a forthcoming academic study from researchers based out of the University of California, Berkeley, who shared data and prepublication findings with The Markup, has concluded that DEWS has failed at its primary goal: improving graduation rates for the students it labels “high risk.”
An internal Department of Public Instruction (DPI) equity analysis conducted in 2021 found that DEWS generated false alarms about Black and Hispanic students not graduating on time at a significantly greater rate than it did for their White classmates. The algorithm’s false alarm rate—how frequently a student it predicted wouldn’t graduate on time actually did graduate on time—was 42 percentage points higher for Black students than White students, according to a DPI presentation summarizing the analysis, which we obtained through a public records request. The false alarm rate was 18 percentage points higher for Hispanic students than White students.
DPI has not told school officials who use DEWS about the findings nor does it appear to have altered the algorithms in the nearly two years since it concluded DEWS was unfair.
The DPI presentation summarizing the equity analysis we reviewed did not include the underlying false alarm rates for Black, Hispanic, and White students that DPI used to make its calculations. It also did not include results for students of other races. The department declined to answer questions about the analysis and, in response to a subsequent public records request, DPI said it had no documentation of the equity analysis results beyond the presentation. (A video of the presentation can be seen here.)
A separate DPI validation test of DEWS’ accuracy in March 2021 shows it was wrong nearly three quarters of the time it predicted a student wouldn’t graduate on time.
It makes the students of color feel like they’re separated … like they automatically have less.
Christopher Lyons, Bradford High class of 2022
Students we interviewed were surprised to learn DEWS existed and told The Markup they were concerned that an algorithm was using their race to predict their future and label them high risk. “It makes the students of color feel like they’re separated … like they automatically have less,” said Christopher Lyons, a Black student who graduated from Bradford High School in 2022.
Wisconsin DPI spokesperson Abigail Swetz declined to answer questions about DEWS but provided a brief emailed statement.
“Is DEWS racist?” Swetz wrote. “No, the data analysis isn’t racist. It’s math that reflects our systems. The reality is that we live in a white supremacist society, and the education system is systemically racist. That is why the DPI needs tools like DEWS and is why we are committed to educational equity.”
In response to our findings and further questions, Swetz wrote, “You have a fundamental misunderstanding of how this system works. We stand by our previous response.” She did not explain what that fundamental misunderstanding was.
To piece together how DEWS has affected the students it has judged, The Markup examined unpublished DPI research, analyzed 10 years of district-level DEWS data, interviewed students and school officials, and collected survey responses from 80 of the state’s more than 400 districts about their use of the predictions.
Our investigation shows that many Wisconsin districts use DEWS—38 percent of those that responded to our survey—and that the algorithms’ technical failings have been compounded by a lack of training for educators.
DEWS is a voluntary program, and DPI encourages educators to use the predictions in combination with other local data about students to make decisions. The agency does not track whether or how schools use the predictions. Principals, superintendents, and other administrators told The Markup they received little or no explanation of how DEWS calculates its predictions or how to translate a label like “high risk” into the appropriate intervention.

In districts like Kenosha, students of color don’t need data to understand the consequences of being judged by biased systems. In 2020, the city grabbed national headlines following the police shooting of Jacob Blake. And earlier this year, the family of a 12-year-old Black student sued the Kenosha Unified School District after an off-duty police officer working security placed her in a chokehold in the lunchroom of her school.
In 2018, the year Lyons entered Bradford High School, a teacher there was filmed repeatedly using a racial slur in front of students. That year, DEWS labeled 43 percent of Black ninth graders in Kenosha high risk, compared to 11 percent of White ninth graders.
By that point, Lyons said he’d already lost motivation academically. “It kind of felt like we weren’t expected to do much,” he said. “It felt like they knew that we were just destined to fail.”
Then something unexpected happened his sophomore year: The COVID-19 pandemic hit, classes went virtual, and, as he put it, his grades “skyrocketed” from a 2.9 GPA prepandemic to a 3.8 GPA after the switch to remote learning. What for many students was a disorienting interruption to their education was for Lyons a reprieve that allowed him to focus. “I didn’t have that social pressure of, like, the teachers around me or the administration around me,” he said. “It was just me, the computer, whoever I was talking to.”
Last year, Lyons began his freshman year at Carthage College in Kenosha on a full-ride scholarship. His journey illustrates the quirks in personality, learning style, and environment that, some experts say, make it counterproductive to predict an individual student’s future based on a population-level analysis of statistically similar students.
Nonetheless, early warning systems that use machine learning to predict student outcomes are common in K-12 and higher education. At least eight state public education agencies provide algorithmic early warning systems or are currently building them for future use, according to a Markup survey of all 50 states. Four states did not respond. Montana was the only state besides Wisconsin that said it had examined how its early warning system performed across different racial groups. Montana Office of Public Instruction spokesperson Brian O’Leary said that his state’s equity study was not yet finished.
“Is DEWS Fair? No ...”
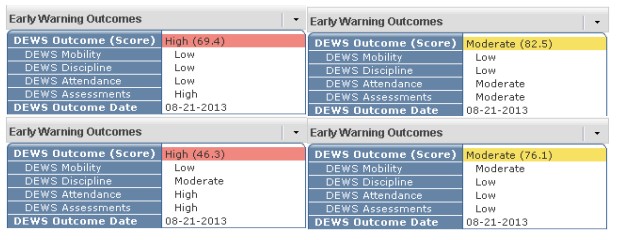
At the beginning of and midway through each year, DEWS calculates how likely each incoming sixth- through ninth-grade student is to graduate from high school on time on a scale of 0 to 100. A score of 90 indicates that students with similar academic, behavioral, and demographic features have graduated on time 90 percent of the time in the past. Any student whose DEWS score (plus margin of error) is below 78.5 is labeled high risk of not graduating on time.
To make it easier for educators to understand the predictions, DPI translates DEWS scores into a simple, color-coded format. Next to every student’s name in the DEWS tab of the statewide information system is a label showing their score and a green “low,” yellow “moderate,” or red “high” risk designation.
During the 2020–21 academic year, more than 32,000 students—15 percent of the state’s sixth through ninth graders—were labeled “high risk.”
Experts say the system is designed in ways that may inadvertently bias educators’ opinions of students and misdirect scarce school resources. Of particular concern is how heavily DEWS draws on factors like race, disability, and family wealth, which are likely to encode systemic discrimination and which neither the school nor student can change. Other data points fed into DEWS, like discipline rates, have clear racial disparities—DPI knows this and has written about it on its website.
“I wonder at the ways in which these risk categories push schools and districts to look at individuals instead of structural issues—saying this child needs these things, rather than the structural issues being the reason we’re seeing these risks,” said Tolani Britton, a professor of education at UC Berkeley, who co-wrote the forthcoming study on DEWS. “I don’t think it’s a bad thing that students receive additional resources, but at the same time, creating algorithms that associate your race or ethnicity with your ability to complete high school seems like a dangerous path to go down.”
When DEWS predicts that a student will graduate, it’s usually right—97 percent of the time those students graduate in the standard four years, according to the 2021 validation test, which shows how the algorithms performed when tested on historical data. But when DEWS predicted a student wouldn’t, it was usually wrong—74 percent of the time those students graduate on time, according to the same test.
This is partially by design. DPI calibrates DEWS to cast a wide net and over-identify students as being at risk of dropping out. In a 2015 paper describing DEWS in the Journal of Educational Data Mining, former DPI research analyst Jared Knowles wrote that DPI was “explicitly stating we are willing to accept” 25 false alarms that students won’t graduate if it means correctly identifying one dropout.
But in its equity analysis, DPI found the algorithms don’t generate false alarms equally.
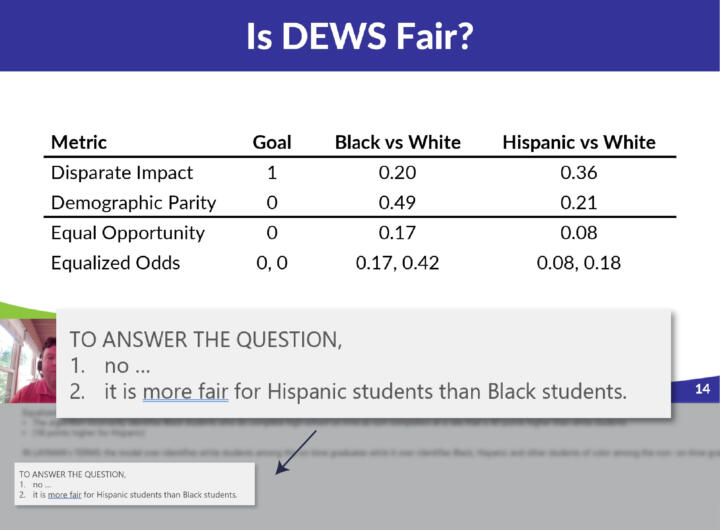
“IN LAYMAN’s TERMS: the model over-identifies white students among the on-time graduates while it over-identifies Black, Hispanic and other students of color among the non- on-time graduates,” a DPI research analyst wrote in notes for the presentation. The presentation does not specify what DEWS scores qualify as on-time graduation, for the purpose of the equity analysis.
The notes for the slide, titled “Is DEWS Fair?” end with the conclusion “no….”
“They definitely have been using a model that has systematic errors in terms of students’ race, and that’s really something that’s got to get fixed,” said Ryan Baker, a University of Pennsylvania education professor who studies early warning systems. “They had demographic factors as predictors and that’s going to overemphasize the meaning of those variables and cause this kind of effect.”
A Decade of DEWS Demystified
Recently, a team of researchers working primarily out of UC Berkeley—doctoral candidate Juan Perdomo, Britton, and algorithmic fairness experts Moritz Hardt and Rediet Abebe—have examined DEWS’ efficacy through a different lens.
Their research using nearly 10 years of DEWS data—which DPI voluntarily shared—is the largest ever analysis of how a predictive early warning system affects student outcomes. While previous studies have asked how accurately early warning systems perform when tested against historical data, the UC Berkeley study examines whether DEWS led to better graduation rates for actual students labeled high risk.
The researchers tested whether graduation rates improved for students whose DEWS scores were just below the 78.5 threshold to put them in the high risk category compared to students whose scores were just above that threshold, placing them in the moderate risk category. If the system worked as intended, students in the high risk category would see improved graduation rates because they received additional resources, but the study found that being placed in the high risk category had no statistically significant effect on whether students graduated on time.
“There is no evidence that DEWS predictions have in any way influenced the likelihood of on-time graduation,” the authors wrote.
If the system was working as intended and schools were directing more resources to students labeled high risk, the UC Berkeley study suggests, it would have a different but also inequitable impact. “If schools select students for intervention by ranking their [DEWS] scores and selecting those with the lowest predicted probability of graduation, underserved students would be systematically overlooked and de-prioritized,” the authors wrote.
That’s because DEWS’ predicted graduation rates don’t accurately reflect students’ true graduation rates. White students, in particular, graduate at much higher rates than their DEWS scores would suggest, according to data shared with The Markup by the UC Berkeley researchers.
For example, students of color who received DEWS scores of 83 went on to graduate on time 90 percent of the time. That’s the same as Wisconsin’s statewide average graduation rate last year. White students who received the same DEWS score of 83 went on to graduate on time 93 percent of the time, above the state average.
But crucially, White students who received significantly lower DEWS scores of 63 graduated on time at essentially the same rate as the higher-scoring White students: 92 percent of the time. But students of color who received DEWS scores of 68 graduated on time only 81 percent of the time, below the state average.
In other words, if educators followed DEWS’ advice and prioritized White students with scores of 63 for help over students of color with scores of 68, they would have prioritized students who ultimately graduate at above-average rates over students who ultimately graduate at below-average rates.
That particular quirk of the algorithm likely hasn’t exacerbated inequality in Wisconsin, the study concluded, because DEWS isn’t improving outcomes for anybody labeled high risk, regardless of race.
Advanced Algorithms, Second-Class School System
From its earliest days, DPI promoted DEWS as a cost-effective tool to combat the state’s “unacceptable” graduation gap. But the early warning system wasn’t the agency’s first-choice solution.
As part of its biannual budget proposal in 2011, Wisconsin DPI, which was under the leadership of Tony Evers, who is now the state’s governor, requested $20 million for an “Every Child a Graduate” grant program that would send resources directly to struggling districts. That year, 91 percent of White students in the state graduated from high school on time compared to 64 percent of Black students.
But then-governor Scott Walker had a different plan for public education. He cut nearly $800 million, about 7 percent, in state funding for public schools from the two-year budget. That included the $20 million for “Every Child a Graduate,” of which Walker’s administration redirected $15 million to build a statewide student information system to house all pupil data in one place.
Denied its grant program but in possession of a wealth of new data, DPI looked for a high-tech solution to its graduation gap. In 2012, it began piloting DEWS.
At the time of its creation, DEWS was one of the most advanced predictive early warning systems in the country. Its accuracy was “on par with some of the most well regarded systems currently in use, but is done at a larger scale, across a more diverse set of school environments, [and] in earlier grades,” Knowles, the former DPI research analyst who built the system, wrote in the 2015 Journal of Educational Data Mining paper.
DPI quickly decided to expand its use of predictive analytics and in 2016 launched a sister algorithm, called the College and Career Readiness Early Warning System (CCREWS), which predicts whether students are “ready” or “not ready” for the ACT and college. In The Markup’s survey of Wisconsin school districts, seven out of 80 respondents said they use CCREWS in some capacity, compared with 30 districts that reported using DEWS.
In 2019, DPI piloted yet another algorithmic model based on DEWS that purported to predict which students would succeed in AP courses. Schools in 11 districts signed up for the pilot, but the project was abandoned after the onset of the COVID-19 pandemic, according to documents obtained through a public records request.
4
Number of percentage points that the graduation gap between Black and White students in Wisconsin has shrunk since 2011, the year before DEWS was piloted.
Over the past decade of the state’s experimentation with predictive algorithms, Wisconsin’s educational inequality has hardly improved.
The graduation gap between Black and White students has shrunk by only four points since 2011, from 27 to 23 percent. Meanwhile, the gulf between Black and White eighth graders’ reading scores in Wisconsin has been the worst of any state’s in the nation on every National Assessment of Educational Progress (NAEP) going back to 2011. It has also had the widest gap of any state between Black and White eighth graders’ math scores on every NAEP since 2009.
“The question I always ask when that data comes out is not just how bad are Black kids doing, [but] how is it that White kids are doing so well?” said Gloria Ladson-Billings, a national expert on education inequality and a retired University of Wisconsin–Madison professor. “It’s not like we don’t know how to get these kids through. The problem is they have to look like Division I athletes for us to care enough.”
Black and Hispanic students in Wisconsin told The Markup that they often feel part of a second-class school system.
Kennise Perry, a 21-year-old student at UW-Parkside, attended Milwaukee Public Schools, which are 49 percent Black before moving to the suburb of Waukesha, where the schools are only 6 percent Black. She said her childhood was difficult, her home life sometimes unstable, and her schools likely considered her a “high risk” student.
“I was the only Black kid in all of my classes. No other representation of anyone who looks like me, and my peers were extremely racist,” she said. “It was really traumatic.… I was just so angry and I didn’t know how to place my anger. I was miserable. So then, of course, the labels and stuff started. But I feel that the difference between people who make it and people who don’t are the people you have around you, like I had people who cared about me and gave me a second chance and stuff. [DEWS] listing these kids high risk and their statistics, you’re not even giving them a chance, you’re already labeling them.”
Waukesha’s school district did not respond to The Markup’s survey or request for comment. However, documents obtained through public records requests show that Waukesha North High School, which Perry attended, signed up to participate in the pilot for DPI’s algorithm designed to predict which students would succeed in AP classes.
Milwaukee Public Schools, the state’s largest district, does not use DEWS or any kind of machine learning for its early warning system, spokesperson Stephen Davis wrote in an email to The Markup. Like many districts and states, it instead uses a low-tech approach that identifies students as on or off track based on whether they’ve hit certain benchmarks, such as being absent for a predefined number of days.
Last year, students at Cudahy High School created its first Black Student Union in response to racist incidents they felt the school’s administration wasn’t properly addressing.

“You know that [White students] already have a leg up,” said Mia Townsend, a junior and vice president of Cudahy’s Black Student Union. “You already feel that separation.… They have more opportunities and they have more leeway when it comes to certain things.”
Students in the BSU have organically provided the same kind of supportive interventions for each other that the state hoped to achieve through its predictive algorithms.
During the 2020–21 school year, 18 percent of White students in Wisconsin took AP exams compared to 5 percent of Black students. Townsend, an honor roll student, said she was on path to avoid AP courses until fellow junior Maurice Newton, the BSU’s president, urged her to accept the challenge. She asked to join an AP English class next year.
“They make it seem like it’s more challenging and it’s honestly the same,” Newton said. “You can pass the class with a good grade.”
In response to The Markup’s questions about DEWS, Cudahy district superintendent Tina Owen-Moore shared an email thread in which staff members expressed that they hadn’t known about and didn’t currently use the predictions but that counselors were “excited about this resource.” After reviewing our findings, however, Owen-Moore wrote, “That certainly changes my perspective!!”
“They Just Handed Us the Data and Said, ‘Figure It Out.’ ”
Many districts who responded to The Markup’s survey said they use DEWS predictions similarly to the way Brown and the staff at Bradford High School in Kenosha do—to identify which new students in their buildings may require additional attention.
In the city of Appleton’s school district, high school case managers use DEWS and other data to identify incoming first-year students in need of support and to determine special education caseloads, for example. Relying “heavily” on DEWS data, Winneconne School District sends letters to parents informing them their child may be at risk, although those letters don’t reference the algorithm.
But some schools have found other, off-label uses for the data. For example, Sara Croney, the superintendent of Maple School District, told The Markup that her staff has used DEWS’ “perceived unbiased data” to successfully apply for a staff development grant focused on reaching unengaged students. In the city of Racine, middle schools once used DEWS to select which students would be placed in a special “Violence Free Zone” program, which included sending disruptive students to a separate classroom.
The Racine School District is “not currently utilizing DEWS or CCREWS,” spokesperson Stacy Tapp wrote in an email.
Many administrators The Markup interviewed said they had received little or no training on how DEWS calculates its predictions or how to interpret them.
“They just handed us the data and said, ‘Figure it out,’ ” said Croney. “So our principals will analyze it and decide who are the kids in the at-risk area.”
DPI provides documentation about how DEWS works and its intended uses on its website, but much of the public-facing material leaves out a key fact about the system: that its predictions are based in part on students’ race, gender, family wealth, and other factors that schools have no control over.
For example, the department’s DEWS Action Guide makes no mention that student race, gender, or free or reduced-price lunch status are key input variables for the algorithms.
DPI’s webpage describing the data used to generate DEWS predictions lists four distinct categories of information: attendance, disciplinary record, number of districts attended in the prior year (mobility), and state test scores. It states that “demographic attributes are used,” but not which ones or how they influence the predictions.
Similarly, when educators view students’ DEWS predictions in the statewide information system, they can examine how students’ attendance, disciplinary record, mobility, and test scores affect the overall risk label, but they are not shown how students’ demographic features affect the prediction.
What I do is directly correlated to DEWS and the information that’s there, and that’s scary to me.
Shari Johnson, Richland School District
Shari Johnson, director of curriculum and instruction for the Richland School District, said her schools were starting to create action plans and assign staff mentors to “high risk” students with the goal of getting them out of that category, especially those at “most risk” because she said it wouldn’t be possible to mentor everyone.
However, when she spoke to The Markup, she didn’t know that characteristics such as a disability or being economically disadvantaged affected a student’s score.
“Whose responsibility is it that we know about these things? That’s my concern in this position, for me to only have found out by chance,” Johnson said. “What I do is directly correlated to DEWS and the information that’s there, and that’s scary to me.”
The disconnect between how DEWS works and how educators understand it to work isn’t news to DPI.
In 2016, researchers with the Midwest Regional Education Laboratory wrote a report for DPI that was never published, based on a survey of middle school principals’ experiences with DEWS. The report, which we obtained through public records requests, concluded that respondents “desired more training and support on how to identify and monitor interventions” and that “time, money, and training on DEWS” were the top impediments to using the system.
Bradford High School principal Brian Geiger said he remembers hearing about DEWS around the time of its launch, back when he was an assistant principal at another Kenosha school, and has used it for various purposes, including summer home visits, ever since. Now Brown, his assistant principal at Bradford, has picked up the practice. Even knowing there are flaws with DEWS, Brown said the predictions are the best data he has for incoming students.
“It’s not a 100 percent predictor. My perception on this is that we kind of use it as a guide,” he said, adding, “I wish we could go visit every single house of all 1,400 kids [enrolled at Bradford High School]. We don’t have a summer school budget to do that.”
Correction, May 11, 2023
A previous version of the map in this article incorrectly included Hawaii, Nevada, New Jersey, North Carolina, and Michigan. Those states use early warning systems, but they do not use algorithms or machine learning to predict student outcomes.