Christine Meyer, a Pennsylvania doctor, has seen some patients come in recently with concerning symptoms: uncontrolled hypertension, spikes in blood sugar levels. The stress of trying to find an appointment to get a COVID-19 vaccine, she said, is “literally making them physically ill.”
“Listen, if your blood pressure gets any higher over this vaccine,” she’s told them, “you’re going to have a much bigger problem than not getting a vaccine.”
One big source of frustration: websites that are difficult to navigate for less savvy web users. Similar to other sites, the Pennsylvania site leads users to an interactive map of blue dots, which then leads out to pharmacies and local health departments with their own sign-up procedures. It’s a system with “nothing intuitive about it,” Meyer said.
“You have an 80-year-old patient, all they’re trying to do is get a vaccine, and they have 50 different places to go try to sign up,” she said, “but no feedback on whether their sign-up worked, no feedback on how long it would take to get a vaccine through that sign-up.”
See our data here.
Those sorts of issues did indeed turn up when The Markup ran a series of tests using our Blacklight tool and Google’s Lighthouse tool on Pennsylvania’s site, along with official COVID-19 vaccination sites for every state, Puerto Rico, and Washington, D.C. Blacklight, a privacy tool, scans sites for trackers and cookies. Lighthouse, meanwhile, measures a website’s performance and accessibility.
Pennsylvania’s vaccine portal performance score (17 out of 100) was in the bottom 25 percent of sites we tested and had the second-lowest score for accessibility in our tests.
“While we are connecting more people to information and resources available online, we recognize that the time it takes to load a page may have increased,” Maggi Barton, a spokesperson for the Pennsylvania Department of Health, said in a statement. “We are actively looking to make further improvements to our information sources.”
But, as anecdotes around the country of people struggling to make vaccine appointments suggest, Pennsylvania’s is not the only site with issues. The Markup found a range of potential problems with state sites around the country.
Privacy
Blacklight tests for a few different things, including the number of ad trackers on each site—meaning the tool can tell you whether third parties receive information about your visit to the site. Such companies then use that information to build a profile of your demographics and interests to use to target advertising. In this case, such trackers share information about people’s visits to COVID-19 vaccination sites. (You can see our data and read more about our methodology for Blacklight here.)
Nevada’s website, which is run through a partnership with a nonprofit organization, Immunize Nevada, contained 24 ad trackers and 45 third-party cookies. Ranking states by number of cookies, Nevada has more than the lowest 46 states combined.
Nevada's, Utah's, and Hawaii’s vaccine websites all have substantially more than the average number of cookies
Third-party cookies found on state vaccine websites
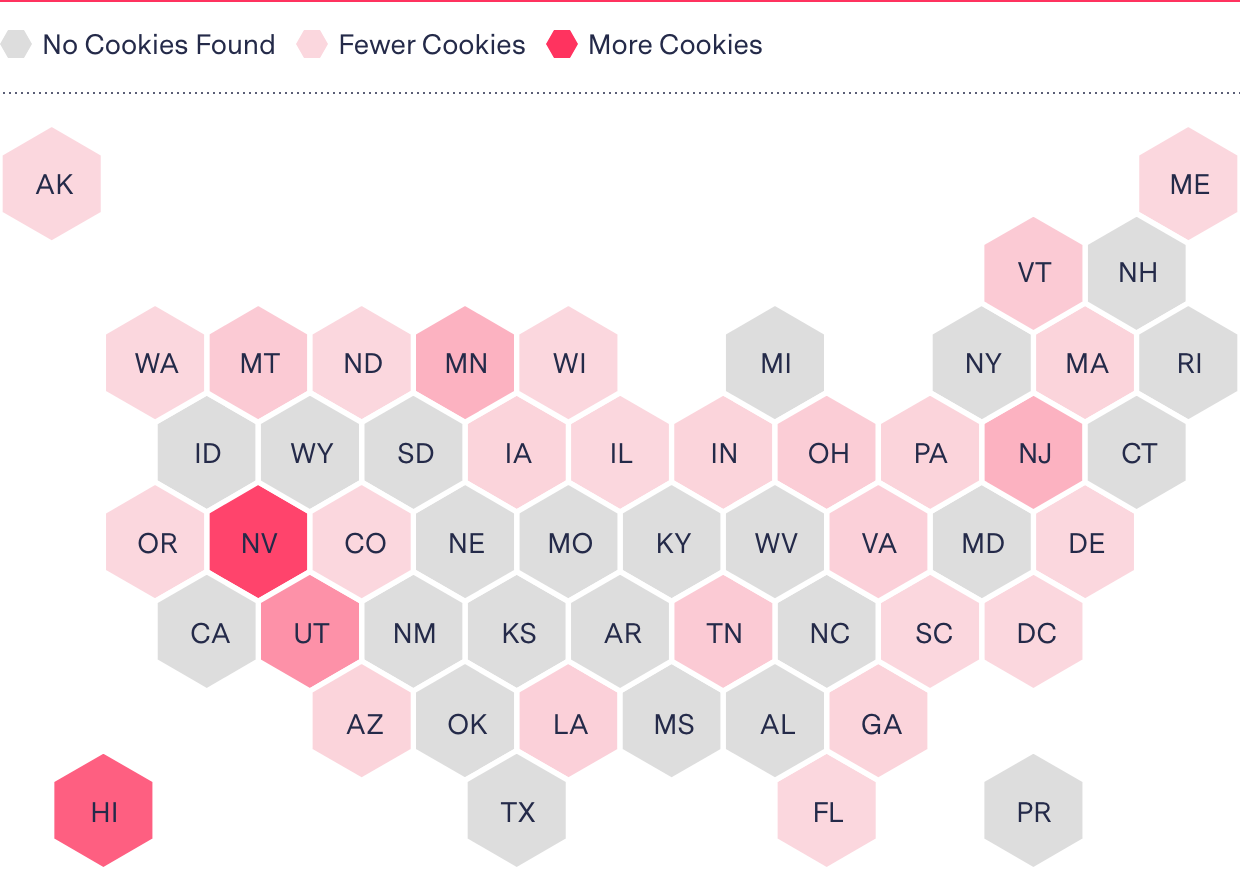
Other states with poor privacy ratings were Utah (10 trackers, 22 third-party cookies), New Jersey (12 trackers, 11 third-party cookies), and Hawaii (17 trackers, 37 third-party cookies). There were some sites that had no ad trackers or third-party cookies at all, such as Texas, New York, Kentucky, West Virginia, New Hampshire, and Puerto Rico. Overall, the average number of ad trackers was 2.8 and the average number of third-party cookies was 3.4.
Marissa Medeiros, a spokesperson for Immunize Nevada, explained that the nonprofit “uses digital advertising to educate and inform Nevadans about these vaccines, and we use Google Analytics to track the performance of these ads.” The site also interacts with Facebook, Instagram, and Twitter, Medeiros explained, which increases cookie counts.
Tom Hudachko, a spokesperson for the Utah Department of Health, said in an email that trackers were used on the state’s site for web analytics purposes and that the site was consistently monitored for speed.
Performance
For performance scores, we used Lighthouse, a widely accepted website testing tool built by Google, to measure how well the sites work on mobile devices, calculating a score based on different metrics. We chose Lighthouse because it is an open source, standards-based testing platform integrated with Google’s Chrome browser technology that can make qualitative measurements for lists of websites.

Lighthouse performs a number of audits that inspect different aspects of a website’s operations and architecture and then calculates these weighted scores to generate a performance score from 0 to 100. One test measures how long it takes for a page to load all of its elements and to be fully functional, measuring the time a browser spends waiting for various code, graphics, or data to be served to it—during which users may see an animated loading icon. We captured this performance score and averaged it out over 30 individual tests per state over two days, run from three locations (New York, Texas, and California).
One of the things that can affect a webpage’s performance is when a publisher “embeds” interactive features from other sites, such as a YouTube video or a Facebook post. The use of such third-party widgets can include trackers and cookies but it can also cost the user in data charges and time spent waiting for a site to load.
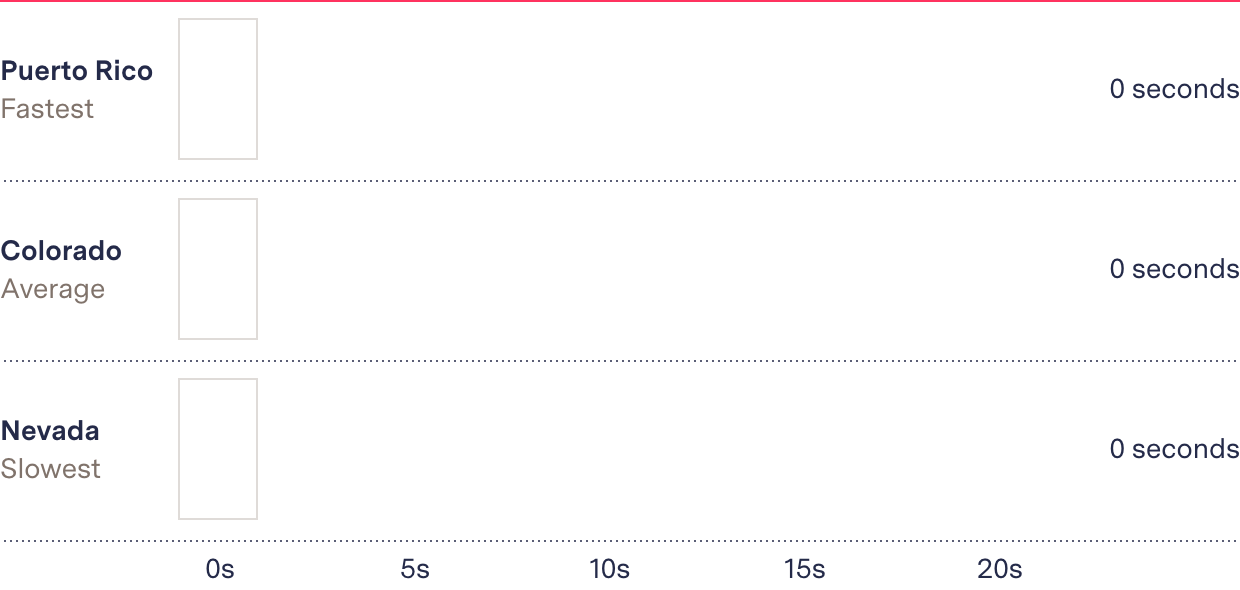
Nevada’s vaccination page features several embedded YouTube videos and Facebook, Twitter, and Instagram posts that offer public health information, featuring health professionals answering common questions in both English and Spanish. Our tests show that Nevada’s page has the lowest average performance score of all the sites we examined.
How fast the contents of a page are visibly populated


Several states with the lowest performance scores, such as Pennsylvania, Ohio, Montana, Washington, and Arizona, also featured embedded widgets, but rather than displaying videos or social media posts, these were third-party interactive maps for users to locate vaccine providers visually and find directions to providers.
Holly Poynter, a spokesperson for the Arizona Department of Health Services, said in an emailed statement that the state has received positive feedback on the map but also offers a text-based list for finding vaccines.
Accessibility
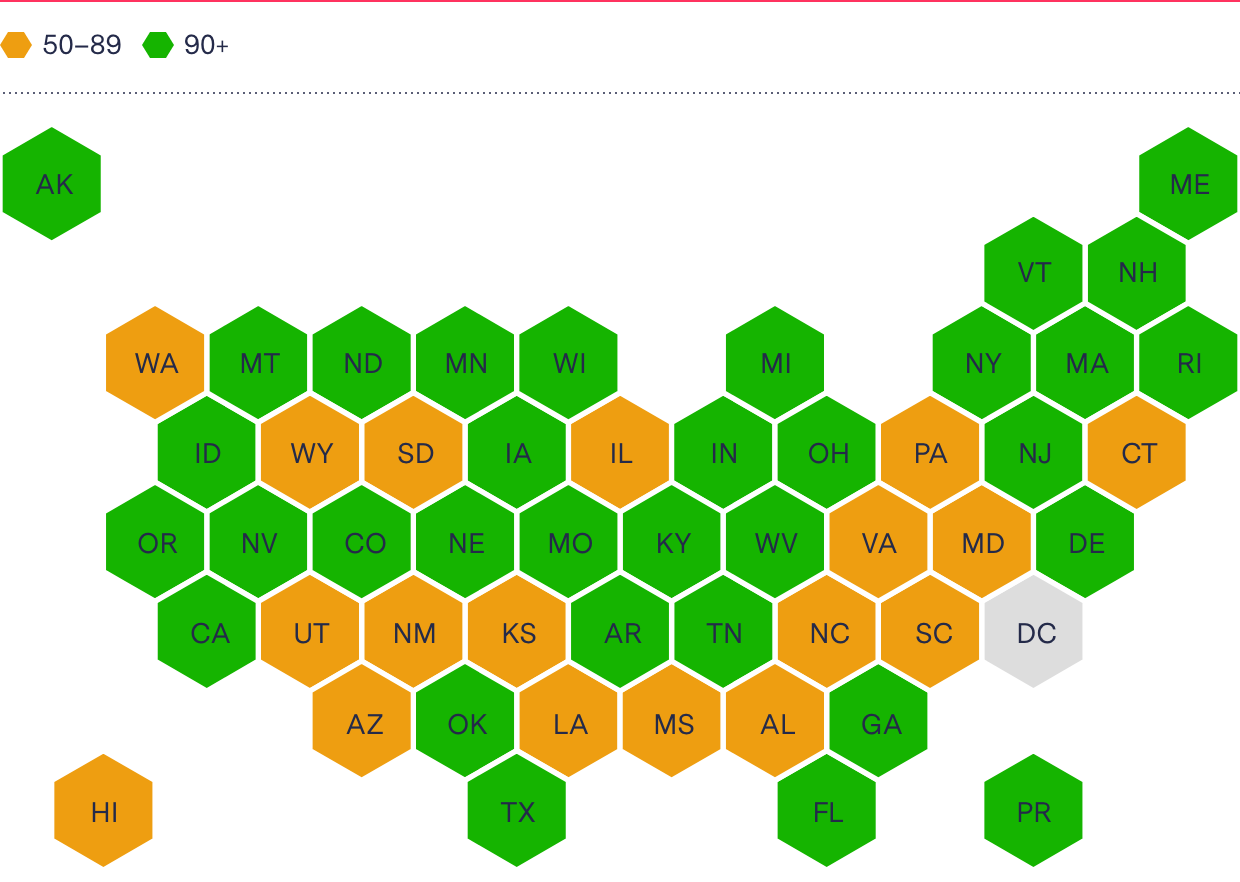
Lighthouse also tests for accessibility, generating a weighted score ranging from 0 to 100, to measure how well each site has implemented code to help users with disabilities access the site. The vast majority of the pages in our test received high accessibility scores through Lighthouse, with 84 percent scoring 85 or higher (out of 100). New Mexico’s site received the lowest average score (66 out of 100) in our accessibility tests.
States scored high on accessibility, although New Mexico, South Carolina, and Pennsylvania scored 75 out of 100 or below
Average accessibility score based on Lighthouse tests
Still, while states have made an effort to accommodate disabled users, a recent survey by Kaiser Health News and WebAIM of state vaccine websites found accessibility issues on nearly all of the pages it inspected. And NBC News reported that blind users were having difficulty using various states’ vaccination pages because the sites used third-party tools such as embedded maps that did not meet states’ accessibility standards.
Hurdles in performance and accessibility are a special burden for many who need the vaccine the most. Low-income communities of color, which have been hit particularly hard by the pandemic, tend to have lower levels of digital access and computer literacy. The elderly and people with disabilities, despite being first in line for the vaccine, are also some of the most likely to struggle through a complex sign-up process. And as vaccine eligibility expands and more people look for appointments, the problems will only compound.
What Researchers Have Seen
Tory Hogan, an assistant professor in health services at Ohio State University, said state health departments are facing a rapidly evolving crisis they were never financially or technically prepared for. Suddenly, state health department websites have gone from providing licenses to restaurants to becoming life-or-death resources for huge swaths of the country.
“They’ve never required the infrastructure that they do now,” Hogan said.
Hogan and other researchers published an analysis of state health department COVID-19 websites last month, looking at how states were providing data on vaccinations and how simple they made the scheduling process.
The researchers found that, as of last month, only 20 percent of websites offered a centralized, online scheduling system. About 40 percent didn’t list vaccine providers with contact information, and almost 30 percent didn’t even link to vaccine information on their front pages.
There are different ways to measure how successful a website is, and while Hogan said no site was perfect, some were better than others at guiding people through the process.
Some states, like New York, have developed centralized health department systems that allow people to schedule a vaccine with multiple providers from one site. Most states, however, have implemented decentralized systems that point visitors to the websites of local health officials or pharmacies.
All over the country people are turning to digital communities, outside of the network of government and pharmacy sites, to figure out how to access vaccines, relying on third-party websites and social media chatter to find slots.
Meyer, the Pennsylvania doctor, started a Facebook group to help people in the state struggling with the system to register for vaccination. The group has helped thousands make appointments so far, sending tips and tricks for signing up on the various sites.
“It’s a very systematic, agonizingly slow, tedious process,” Meyer said. But it’s the best system many people in the state have been able to find.